Tag Archives: portfolio

This New ETF Looks To Take Advantage Of The Stock Buyback Trend

Summary State Street launched the SPDR S&P 500 Buyback ETF with the intention of capitalizing on the recent share buyback popularity. Its closest comparable, the PowerShares Buyback Achievers ETF, has doubled the return of the S&P 500 since its inception in 2006. Roughly 80% of S&P 500 companies have bought back their own shares within the last couple years. Companies, it seems, have had an insatiable appetite for buying back their own shares lately. It’s a strategy that is a bit of a double-edged sword. It’s great for shareholders as a reduced share count boosts earnings per share and almost always pops the share price. It also works out better for taxes because it’s essentially a tax-free transaction (as opposed to dividends which would be taxable). On the other hand, it could be an indication that the company doesn’t necessarily have any higher returning projects to invest in and instead are choosing to return the excess capital to shareholders. Big names like Boeing (NYSE: BA ), Microsoft (NASDAQ: MSFT ) and Apple (NASDAQ: AAPL ) have been big purchasers of their own stock lately and it’s estimated that 80% or more of S&P 500 companies have bought back their own shares recently. Given the effects that it has on stock prices, it’s not surprising that an ETF is attempting to jump on the trend in an attempt to deliver oversized returns. Earlier this month, State Street launched the SPDR S&P 500 Buyback ETF (NYSEARCA: SPYB ). The goal of the ETF is simple. It looks to invest in the top 100 stocks with the highest buyback ratios in the S&P 500 over the last 12 months. Current top holdings include big names like Southwest Airlines (NYSE: LUV ), Yahoo (NASDAQ: YHOO ) and Dollar Tree (NASDAQ: DLTR ). The fund’s 0.35% annual expense ratio is not unreasonable as it falls in line with the expense ratios of many of State Street’s SPDR ETFs, but is a little on the high side considering the fact that it is passively benchmarked to the S&P 500 Buyback Index. While the concept of this ETF will be of interest to many investors, I can’t help thinking that this type of ETF has been done and with much success already. The PowerShares Buyback Achievers ETF (NYSEARCA: PKW ) was launched back at the end of 2006, and since then has returned a total of 92% compared to the S&P 500’s return of 44%. In just the past five years, the Buyback Achievers ETF has returned 142% compared to the S&P 500’s 93%. Perhaps the key differentiator between the two ETFs is the expense ratio. The SPDR S&P 500 Buyback ETF charges roughly half of the 0.71% expense ratio that the PowerShares ETF charges. Management styles are slightly different – the SPDR ETF is equally weighted whereas the PowerShares ETF is not – but the concept is substantially the same. Liquidity is also a big factor currently. The PowerShares ETF manages roughly $2.7B and trades around 380K shares a day. The SPDR ETF is obviously brand new and has just $5M under management with very thin trading volume. Conclusion Given the popularity of stock buybacks in the last 1-2 years, it’s not surprising to see State Street begin offering a product designed to capture the performance boost that typically comes with them. PowerShares has already proven that this strategy can produce above average returns over a lengthy period of time. While State Street has demonstrated a great deal of success over time with its SPDR family of ETFs, I feel that investors looking to jump on the buyback bandwagon might be better served starting with the PowerShares Buyback ETF first. First, what’s the harm in going with the product with the proven track record. Second, give the SPDR Buyback ETF time to build an asset and trading base so it can shake out some of its operating inefficiencies first. Overall, I think the SPDR S&P 500 Buyback ETF will ultimately be a solid addition to the State Street lineup and warrants investor consideration. Disclosure: The author is long AAPL. (More…) The author wrote this article themselves, and it expresses their own opinions. The author is not receiving compensation for it (other than from Seeking Alpha). The author has no business relationship with any company whose stock is mentioned in this article.
Firsthand Technology Value Fund: Wide Discount, Too Much Risk

SVVC has just completed a tender offer and other changes pushed by an activist investor group. SVVC’s portfolio is now concentrated in a small number of high-risk investments. SVVC’s past successes are notable, but its venture funding approach is too risky for most. Firsthand Technology Value Fund (NASDAQ: SVVC ) can lay claim to some pretty good calls, including investing in such winners as Facebook (NASDAQ: FB ) and Twitter (NYSE: TWTR ). But with those wins behind it, the portfolio’s top holdings are no longer household names. If you like the idea of investing in emerging technology companies, perhaps you’ll like SVVC, but otherwise this is a risky investment option even with its massive discount and large trailing yield. What a difference a year makes In February 2014, SVVC’s top two holdings made up roughly 35% of the closed-end fund’s assets. Those two stocks were Facebook and Twitter. Interestingly Firsthand had started investing in Facebook in late 2011, roughly nine months before it went public. The closed-end fund, or CEF, started investing in Twitter in mid 2012, roughly a year before it went public. Those were big wins for the fund and, clearly, represented a huge chunk of assets. That’s part of the reason why Bulldog Investors, an activist hedge fund, got involved with SVVC. Bulldog essentially came in with a list of demands to reduce the fund’s wide discount. When it didn’t receive the reply it wanted, Bulldog went public with its fight. That fight came to an end in May of last year. Firsthand agreed to buy back shares, conduct a tender offer at 95% of net asset value, or NAV, and sell its stakes in Twitter and Facebook with the sale proceeds distributed to shareholders. That’s pretty much all a done deal at this point, and leaves investors with one big question: “What exactly is left behind?” For starters, the top five holdings , which account for roughly 45% of the fund, is a list of companies you’ve probably never heard of. None of them are publicly traded and Firsthand has a controlling stake in the top holding, IntraOp Medical (over 12% of SVVC’s assets). What does this mean for you? So Firsthand is a very different fund today than it was a year ago. But what does that mean for investors? First off, the 18% trailing yield, according to the Closed-End Fund Association , was related to the distribution of gains from selling Twitter and Facebook shares. That’s done. Don’t expect a repeat. Second, the 37% discount is based on estimated values for a large number of non-traded holdings. You have to ask if that discount is real, particularly since Firsthand has to value a company in which it has a controlling stake. Third, the 95% of NAV tender offer has been closed. Not surprisingly it was oversubscribed. So with that offer off the table, there’s no reason to expect Firsthand to trade higher based on a chance to get out quickly, and at a profit, via a tender offer. And there’s really no reason to think that Firsthand would switch to open-end status, which is something that often happens with funds that trade at deep discounts. For starters, Bulldog has agreed to step back from its aggressive stance – it was the logical option to push for SVVC to become an open-end fund. And then there’s the not-so-minor fact that Firsthand actually started life as an open-end fund, oddly switching to the closed-end structure in 2011. The timing of that switch actually wasn’t so odd, since it took place after the technology bust brought down both the values and unbridled enthusiasm for tech funds like this one. The “odd” thing is that an open-end fund would become closed-end, since things normally happen the other way around. Another impediment to becoming open-ended, and one of the biggest risks of the CEF, is that the fund owns a collection of securities that aren’t publicly traded. Such investments don’t play nicely with open-end funds and are, indeed, more appropriate for closed-end funds. So SVVC’s current structure as a closed-end fund is probably the right structure. That said, it doesn’t mean you should want to own a fund that invests in such holdings. Don’t buy this for the discount At the end of the day, Firsthand Technology Value Fund is an interesting story. But it isn’t a good investment option for most people. Essentially, it’s a way to invest in startups. And that business is like a power hitter that strikes out a lot, but also hits a few home runs along the way. That’s not the type of trade off most conservative investors are willing to make. So ignore the discount and the trailing yield here, and pay far more attention to what this CEF does. If you can’t stomach venture capital risk, stay away. Disclosure: The author has no positions in any stocks mentioned, and no plans to initiate any positions within the next 72 hours. (More…) The author wrote this article themselves, and it expresses their own opinions. The author is not receiving compensation for it (other than from Seeking Alpha). The author has no business relationship with any company whose stock is mentioned in this article.

BIK: Diversified Emerging Markets Means China, Right?

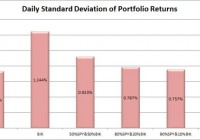
Summary The top 7 holdings are all Chinese, despite the ETF being labeled as diversified emerging markets. The standard deviation is pretty high and makes it difficult to try to use the ETF to lower risk across the total portfolio. On the positive side, the correlation is fairly low and the liquidity was solid which makes the statistics more reliable. I like investing in ETFs, and one of the ETFs I was looking at recently is the SPDR S&P BRIC 40 ETF (NYSEARCA: BIK ). It tracks the S&P BRIC 40 Index, and allocates at least 80% of the funds to the assets in the index. The Morningstar Category is “Diversified Emerging Markets”. However, after looking into it for a while I felt like it would be more representative to say the ETF is heavily invested in China. 67% of the ETF’s investments are in China. The only other markets included are Brazil, India, and Russia. I believe there are two methods for investing. Either you should know more than the other people performing analysis so you can make better decisions, or use extensive diversification and math to outperform most investors. Under CAPM (Capital Asset Pricing Model), it is assumed every investor would hold the same optimal portfolio and combine it with the risk free asset to reach their preferred spot on the risk and return curve. Do you know anyone that is holding the exact same portfolio you are? I don’t know of anyone else with exactly my exposure, though I do believe there are some investors that are holding nothing but the SPDR S&P 500 Trust ETF (NYSEARCA: SPY ). In general, I believe most investors hold a portfolio that has dramatically more risk than required to reach their expected (under economics, disregarding their personal expectations) level of returns. In my opinion, every rational investor should be seeking the optimal combination of risk and reward. For any given level of expected reward, there is no economically justifiable reason to take on more risk than is required. However, risk and return can be difficult to explain. I’ve been approximating risk by using the standard deviation of daily returns. Yields BIK has a 3.45% Distribution Yield and 2.65% SEC Yield. I believe a portfolio with a stronger yield is superior to one with a weaker yield if the expected total return and risk is the same. I like strong yields on portfolios because it protects investors from human error. One of the greatest risks to an otherwise intelligent investor is being caught up in the mood of the market and selling low or buying high. When an investor has to manually manage their portfolio, they are putting themselves in the dangerous situation of responding to sensationalistic stories. I believe this is especially true for retiring investors that need money to live on. By having a strong yield on the portfolio it is possible for investors to live off the income as needed without selling any security. This makes it much easier to stick to an intelligently designed plan rather than allowing emotions to dictate poor choices. In the recent crash, investors that sold at the bottom suffered dramatic losses and missed out on substantial gains. Investors that were simply taking the yield on their portfolio were just fine. Investors with automatic rebalancing and an intelligent asset allocation plan were in place to make some attractive gains. Expense Ratios The expense ratio for BIK is .50% for both gross and net expense ratios. Some analysts are heavily opposed to focusing on expense ratios. I don’t think investors should make decisions simply on the expense ratio, but the economic research I have covered supports the premise that overall higher expense ratios within a given category do not result in higher returns and may correlate to lower returns. The required level of statistical proof is fairly significant to determine if the higher ratios are actually causing lower returns. I believe the underlying assets, and thus Net Asset Value, should drive the price of the ETF. However, attempting to predict the price movements of every stock within an ETF would be a very difficult and time consuming job. By the time we want to compare several ETFs, one full time analyst would be unable to adequately cover every company. On the other hand, the expense ratio is the only thing I believe investors can truly be certain of prior to buying the ETF. I ran some historical numbers on the ETF and compared them to SPY to get a feel for how volatile the ETF was. My starting point was January 2012 and I ran the comparisons over a 3 year sample period. (click to enlarge) The portfolio had a 72.12% correlation to SPY when using daily values, which suggests a fairly significant connection. However, while SPY moved up substantially during the 3 year period, BIK had a fairly weak total return of only a few percentage points. In my opinion, it’s reasonable to think the daily correlation just reflects large amounts of money pouring in and out of the market. The returns over a long time period seem to be substantially less correlated to SPY. While SPY had a total return of 71.4% during that three year period, BIK returned only 4.95%. The liquidity looks solid with around 90,000 shares per day changing hands and 0 days in the last 3 years where the trading volume was 0. What are the holdings? Investors should at least glance at the holdings, even if they intend to buy an ETF on the premise that markets are efficient. By looking at the individual holdings the investors can check if the ETF will have a substantial overlap with other positions that they hold. In the case of BIK, investors should be aware of potential overlap with any other large holdings they have in China. (click to enlarge) Tencent Holdings Ltd. ( OTCPK:TCEHY ) is a Chinese investment holding company and Baidu Inc. ADR (NASDAQ: BIDU ) is a Chinese-language internet search provider. Outside of those 2, everything in the top 6 has China in its name. I assume most people are familiar with Alibaba (NYSE: BABA ). The first holding that isn’t in China is the 8th holding on the list. Conclusion BIK is an interesting ETF. At first it seems like it would be heavily diversified, but China is a fairly major position within the ETF. Therefore, when I am comparing BIK I may focus on comparing it to other Chinese focused ETF as much as I compare to other broadly diversified international ETFs. The standard deviation is very high, but I expect that for emerging markets. The total return for the sample period is quite sad, but the intent of diversification is to ensure a larger sample size that can reduce the overall level of deviations. However, the ETF does have fairly solid liquidity represented in both the average trading volume and the lack of days with shares changing hands. The yields are strong, which is a slight positive, but with the volatility of the ETF a retiring investor using it for yield would still be increasing the volatility of their portfolio. It’s a difficult call on which way to go in that regard and each investor would have to look at their personal tolerances. The ETF was at a significant premium to NAV when I looked. The expense ratio is not unreasonable for the exposure (emerging markets), but it did surprise that the emerging markets included so many major positions related to China. Disclosure: The author has no positions in any stocks mentioned, and no plans to initiate any positions within the next 72 hours. (More…) The author wrote this article themselves, and it expresses their own opinions. The author is not receiving compensation for it (other than from Seeking Alpha). The author has no business relationship with any company whose stock is mentioned in this article. Additional disclosure: Information in this article represents the opinion of the analyst. All statements are represented as opinions, rather than facts, and should not be construed as advice to buy or sell a security. Ratings of “outperform” and “underperform” reflect the analyst’s estimation of a divergence between the market value for a security and the price that would be appropriate given the potential for risks and returns relative to other securities. The analyst does not know your particular objectives for returns or constraints upon investing. All investors are encouraged to do their own research before making any investment decision. Information is regularly obtained from Yahoo Finance, Google Finance, and SEC Database. If Yahoo, Google, or the SEC database contained faulty or old information it could be incorporated into my analysis. The analyst holds a diversified portfolio including mutual funds or index funds which may include a small long exposure to the stock.