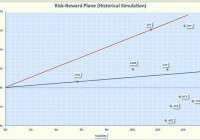
Summary Convertible CEFs offer appealing distributions but their overall performance has not been great. Convertible CEFs have been more volatile than either high yields bonds or the general stock market. CHY has been the best performing CEF but it is now selling at a premium which reduces its attractiveness. As a retiree, I am continually looking for sources of high income but I also don’t want to court excessive risk. This search led me to consider Convertibles Closed End Funds (CEFs). I wrote an article about a year ago that reviewed the reward-versus-risk benefits of this asset class. This article updates the previous article to see how convertible funds have fared over the past year. However, before jumping into the analysis, I will recap some of the characteristics of convertible securities. A “convertible security” is an investment, usually a bond or preferred stock that can be converted into a company’s common stocks. A company will typically issue a convertible security to lower the cost of raising money. For example, many investors are willing to accept a lower payout because of the conversion feature. The conversion formula is fixed and specifies the conditions that will allow the holder to convert into common stock. Therefore the performance of a convertible is heavily influenced by the price action of the underlying stock. As the stock prices approaches or exceeds the “conversion price” the convertible tends to act more like an equity. If the stock price is far below the conversion price, the convertible acts more like a bond or preferred share. Convertible CEFs usually contain a mixture of convertible securities and high yield bonds. The attraction of convertible CEFs is that they offer upside potential with some protection on the downside. Granted that with a portfolio of high yield bonds and convertibles the downside protection is limited (as evidenced by severe losses in 2008). However, over the long run, the fund manager seeks to obtain the “sweet spot” between fixed income and equity that will enable him to outperform his peers. The funds that were analyzed in my previous article are summarized below. All these funds have histories that go back to at least 2007 but in this analysis, I concentrated on near term performance. I will touch on long term risk and rewards at the end of the article. AGIC Convertible and Income (NYSE: NCV ). This CEF sells for a premium of 6.4%, which is similar to the premium a year ago. Over a 3 year period, the premium has averaged 7.5%. The fund has a portfolio of 127 holdings, consisting of 57% convertible securities and 40% high yield bonds. The price of this fund dropped 57% in 2008 but rebounded an amazing 143% in 2009. The fund utilizes 31% leverage and has an expense ratio of 1.2%. The distribution is a high 12.1%, which is received from income with no return of capital (NYSE: ROC ) over the past year. Due to the high payout ratio, the fund tends to invest in lower quality securities that provide higher yield. AGIC Convertible and Income II (NYSE: NCZ ). This CEF sells for a high premium of 13.3%, which is the same as a year ago. Over a 3 year period, the fund sold at an average premium of 10.7%. The portfolio contains 126 holdings, consisting of 57% convertibles securities and 41% high yield bonds. This fund uses a similar investment strategy as its sister fund NCV. The price of this fund plummeted 61% in 2008 but rocketed 145% in 2009. The fund utilizes 31% leverage and has an expense ratio of 1.2%. The distribution is a high 12%, which is generated by income with no ROC over the past year. As with its sister fund, NCZ has migrated to lower quality securities to maintain the high distribution. Calamos Convertible and High Yield (NASDAQ: CHY ). This fund sells at premium of 4.6%, which is much different than a year ago when the fund sold at a discount of 6.3%. Over that past 3 years, the fund has sold at an average discount of 3.6%. The portfolio has 277 holding, consisting of 59% convertibles and 36% high yield bonds. About 15% of the holdings are investment grade. The price of this fund only dropped 27% in 2008 and it rebounded 51% in 2009. The fund uses 28% leverage and has an expense ratio of 1.5%. The distribution is 8.2%, which consists of mostly income with a small amount of ROC over the past year. The fund tends to focus on higher quality convertibles that are selling near the conversion price, making this fund more equity-like. Calamos Convertible Opportunities and Income (NASDAQ: CHI ). This CEF sells for a premium of 1%, which is similar to the 1.3% premium of a year ago. Over the past 3 years, the fund has sold on average at a small discount of 0.1%. The portfolio has 276 holdings, consisting of 52% convertibles and 41% high yield bonds. This fund uses a similar investment strategy as its sister fund CHY. The price of the fund dropped 35% in 2008 and rebounded 67% in 2009. The fund utilizes 28% leverage and has an expense ratio of 1.5%. The distribution is 8.6%, comprised of income with some ROC over the past year. Advent Claymore Convertible and Income (NYSE: AVK ). This CEF sells for a discount of 11.1%, which is a larger discount than the 9.8% discount of a year ago. Over the past 3 years, the discount has averaged 7.9%. The fund’s portfolio has 308 holdings, consisting of 65% convertibles and 27% high yield bonds. About 12% of the securities are from firms based outside of the United States and 12% are investment grade. The fund uses 3 quantitative models to identify convertibles and bonds that have an attractive reward to risk. The price of the fund dropped 47% in 2008 and rebounded 56% in 2009. The fund utilizes 37% leverage and has an expense ratio of 2%. The distribution is 6.7% consisting primarily of income and ROC. Recently the ROC has been about 40% of the distribution. The Net Asset Value (NYSE: NAV ) has been dropping so some of the ROC appears to have been destructive. Advent Claymore Convertible Securities and Income (NYSE: AGC ). This CEF sells for a large discount of 14.9%, which is a larger discount than the 10.6% of a year ago. Over the past 3 years, the discount has averaged 10.2%. The fund has 316 holdings with 64% in convertible securities, 28% in high yield bonds. About 22% of the securities are from firms domiciled outside of the United States. Like its sister fund AVK, AGC uses quantitative models to select securities. The price of the fund dropped 56% in 2008 and gained 58% in 2009. The fund uses a high 41% leverage and has a high expense ratio of 3.1%. The distribution is 8.7%, consisting primarily of income, and ROC. Recently over 50% of the distribution has been ROC, some of which has likely been destructive. As a reference, I compared the performance of the convertible CEFs to the following Exchange Traded Funds (NYSEMKT: ETF ). SPDR S&P 500 (NYSEARCA: SPY ) . This ETF is a proxy for the overall stock market and contains all 500 stocks in the S&P 500. It has and expense ratio of only 0.09% and yields 1.8%. iShares iBoxx $ High Yield Corporate Bonds (NYSEARCA: HYG ). This ETF is a proxy for the high yield bond market. The fund holds over 1,000 high yield bonds, has an expense ratio of 0.5% and yield 5.7%. SPDR Barclay’s Capital Convertible Bond (NYSEARCA: CWB ) . This is the largest and most liquid convertible bond ETF. The fund was launched in 2009 so does not have any history during the bear market years and was not included in my original analysis. The fund holds about 100 convertible bonds with 67% in non-investment grade. The ETF has an expense ratio of 0.4% and yielded 4.5% over the past year. To determine how these funds have fared over the past 12 months I used the Smartfolio 3 program. The results are shown in Figure 1 where the rate of return in excess of the risk free rate (called Excess Mu on the charts) is plotted against volatility. (click to enlarge) Figure 1: Reward and Risk over past 12 months The figure indicates that there has been a wide range of returns and volatilities associated with convertibles CEFs. For example, CHY had the highest return but also had a high volatility. Was the increased return worth the increased volatility? To answer this question, I calculated the Sharpe Ratio for each fund. The Sharpe Ratio is a metric, developed by Nobel laureate William Sharpe that measures risk-adjusted performance. It is calculated as the ratio of the excess return over the volatility. This reward-to-risk ratio (assuming that risk is measured by volatility) is a good way to compare peers to assess if higher returns are due to superior investment performance or from taking additional risk. On the figure, I also plotted a red line that represents the Sharpe Ratio of SPY. If an asset is above the line, it has a higher Sharpe Ratio than the S&P 500, which means it has a higher risk-adjusted return. Conversely, if an asset is below the line, the reward-to-risk is worse than the S&P 500. Similarly, the blue line represents the Sharpe Ratio associated with high yield bonds. Some interesting observations are apparent from the plot. The past 12 months has not been kind to most convertible funds, with only two of the CEFs (CHI and CHY) able to book positive returns. Convertible bonds CEFs have been very volatile, with volatilities greater than the overall stock market and high yield bonds. The large fluctuations in the price of the CEFS was likely driven by both the nature of the asset class and the fact that CEFs are inherently volatile due to leverage and premium/discount variations. As you would expect, the stock market outperformed all the convertible funds. However, CHY came close in risk-adjusted performance. The convertible bond ETF was less volatile than the CEFs. With the exception of CHY, CWB outperformed all the CEFs on a risk-adjusted basis. Several convertible funds (CWB, CHI, and CHY) had better risk-adjusted performance than high yield bonds. However, high yield bonds had a better return with less volatility than the other CEFs in the analysis. If you are considering investing in these asset classes, it is a good idea to assess how much diversification you might receive if you purchase more than one fund. To be “diversified,” you want to choose assets such that when some assets are down, others are up. In mathematical terms, you want to select assets that are uncorrelated (or at least not highly correlated) with each other. I calculated the pair-wise correlations associated with the convertible funds. I also included SPY and HYG to assess the correlation of the funds with other asset classes. The data is presented in Figure 2. (click to enlarge) Figure 2. Correlation over past 12 months The figure illustrates what is called a correlation matrix. The symbols for the funds are listed in the first column on the left side of the figure along with SPY. The symbols are also listed along the first row at the top. The number in the intersection of the row and column is the correlation between the two assets. For example, if you follow CHY to the right for three columns you will see that the intersection with CHI is 0.751. This indicates that, over the past year, CHY and CHI were 75%% correlated. Note that all assets are 100% correlated with themselves so the values along the diagonal of the matrix are all ones. The last row of the matrix allows us to assess the correlations of the funds with SPY. There are several observations from the correlation matrix. As you might expect, pairs from the same family had relatively high correlations: CHI and CHY were correlated 75%, AGC and AVK were correlated 69%, and NCV and NCZ were correlated 85%. Across families the pair-wise correlations among the CEFs were moderate. CWB was highly correlated with SPY (89%). The CEFs were only moderately correlated with SPY. Similarly, the CEFs were also moderately correlated with HYG. Overall, you receive reasonable diversification is you purchase convertibles CEFs from different families. The convertible funds were also not highly correlated with high yield bonds or the general stock market. However, if you have a general equity portfolio, CWB does not offer substantial diversification. With the exception of CHY, convertible CEFs have not been good performers over the past 12 months. However, I typically have a longer investment horizon than one year so I wanted to see how well these funds performed over the entire bear-bull cycle. So for a final assessment, I re-ran the analysis from October 12, 2007 (the high of the market before the bear market began) to the present. The results are shown in Figure 3 (click to enlarge) Figure 3: Reward and Risk over bear-bull cycle As shown in the figure, convertible funds generally had a much improved performance when we considered the entire bear-bull cycle. With the exception of AVK and AGC, the CEFs outperformed high yield bonds on a risk-adjusted basis. CHY was even able to best SPY by a small amount. Bottom Line So where does this analysis leave us? CHY has clearly been the best performer for the periods analyzed. This is likely one of the reasons this CEF is selling at a premium. However, I generally do not like to purchase funds at a premium so for myself I would hold off on purchasing until the premium dissipated. Although NCZ and NCV have performed well in the past, their recent performance has left much to be desired. I see no reason to pay large premiums for these funds. I may be missing something so I welcome reader’s feedback. AGC and AVK are selling at large discounts but both have significantly lagged in performance so I could not recommend them. Bottom line is that under the current conditions, I would beware of convertible CEFs. If you are a risk tolerant investor who want to add this asset class to your portfolio, my advice would be to wait for a better entry point. Disclosure: The author has no positions in any stocks mentioned, and no plans to initiate any positions within the next 72 hours. (More…) The author wrote this article themselves, and it expresses their own opinions. The author is not receiving compensation for it (other than from Seeking Alpha). The author has no business relationship with any company whose stock is mentioned in this article.