Tag Archives: portfolio

Searching For Value With A Refiners-Heavy ETF

Summary Low oil has weighed on the energy sector. Refiner-heavy ETF offers a value play for investors. Why focus on refiners. With oil prices making new lows on an almost daily basis, energy equities and the corresponding exchange traded funds appear unappealing. Falling stock prices coupled with declining earnings have the beaten up energy sector looking pricey on valuation, but one of the sector’s sturdiest industry groups is presenting investors with good value. Attractive valuations among oil refiners can be accessed with the PowerShares DWA Energy Momentum Portfolio ETF (NYSEARCA: PXI ) . “After stripping out the implied MLP-related valuations, we find the multiples to be far more reasonable with the group currently trading at ~5.0x, in line with average levels seen in late 2013-early 2014. More importantly, revisions are likely to remain a steady tailwind, with nearly 10% upside to 2015 Street EBITDA estimates on our forecast,” said Deutsche Bank in a note posted by Ben Levisohn of Barron’s . In lieu of a dedicated refiners ETF, the $161.6 million PXI acts as a solid alternative. At least six of the ETF’s top 10 holdings, a group that combines for over 43% of the fund’s weight, are refiners. PXI tracks the DWA Energy Technical Leaders Index, which attempts to identify energy sector constituents displaying positive relative strength characteristics. With refiners among the energy sector ‘s relative strength leaders at the moment, PXI features robust refiner exposure. Refiners can prove durable when oil prices decline because those falling prices boost refining margins. PXI has made good on that theory. Over the past three months, the ETF has traded modestly higher while the Energy Select Sector SPDR ETF (NYSEARCA: XLE ) has lost 6.3%. The United States Oil ETF (NYSEARCA: USO ) has plunged 26.6% over that period. Citing “an overall healthy refining backdrop (post turnaround risk there but crude dynamics supportive for now), a healthy 1Q EPS setup (estimates look low) and higher investor appreciation for the retail business,” among other catalysts, Deutsche Bank sees more upside for refiners, according to Barron’s. The bank is bullish on Valero Energy (NYSE: VLO ), Marathon Petroleum (NYSE: MPC ), Tesoro (NYSE: TSO ) and Phillips 66 (NYSE: PSX ). All four of those stocks are top 10 holdings in PXI and the quartet combines for 15.7% of the ETF’s weight. PowerShares DWA Energy Momentum Portfolio (click to enlarge) Disclosure: The author has no positions in any stocks mentioned, and no plans to initiate any positions within the next 72 hours. (More…) The author wrote this article themselves, and it expresses their own opinions. The author is not receiving compensation for it. The author has no business relationship with any company whose stock is mentioned in this article.
Why I Am Hedging My Portfolio With UVXY

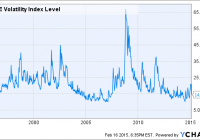
Summary The stock market is hovering near all time highs. The current bull market at 6 years is approaching the historical average. The VIX Index has not closed a month over 30 in more than 3 years. I usually stay away from investments that do not have tangible asset backing, but I have made an exception in the case of the Pro Shares Ultra VIX Short Term ETF (NYSEARCA: UVXY ). Perfect Portfolio Insurance What exactly is UVXY? According to its prospectus on the Pro Shares website, it seeks daily investment results that correspond to 2x the daily performance of the S&P 500 VIX Short-Term Futures Index. What this basically means is that this ETF rises and falls with the level of the VIX, which is more commonly referred to as “The Fear Index.” With general market levels at all time highs, there is not much fear permeating today’s business landscape. However, as market historians have learned time and again, fear is one of the most powerful human emotions, and can skyrocket at a moment’s notice. Let’s look at some of the possible reasons why the VIX could increase dramatically in the near future. The VIX Is Below Its 20-Year Averages Take a look at the following 20 year chart for the VIX: ^VIX data by YCharts As you can see, the VIX hasn’t closed a month above 30 since November of 2011, over 3 years ago. The VIX has risen to 30 or above on 10 different occasions throughout the past two decades, leaving us with an average of one spike above 30 every two years. The longest time the VIX remained below 30 was 3/31/03-9/30/08, a period of 5.5 years. Although this was a long wait, the VIX jumped all the way to its 20 year high of over 65 shortly thereafter. An era of low fear can only exist for so long in the volatile world of the stock market. This current run of low VIX readings is the second longest of the past two decades, and the longer that it continues, the higher the probability of a spike, based on historic averages. The Current Bull Market Is Almost 6 Years Old As a student of the stock market, I am fascinated by the bull and bear trends that are the fabric of investing. Although hindsight is always 20/20 in the stock market, the current trend is approaching the historical average bull market length. The longer that the market keeps running, the harder the inevitable fall will become. Since the 1950s, there have been 9 bear markets , which are defined as a drop in the S&P 500 by 20% or more from its high point. That leaves us with roughly one bear market every 6.5 years. The current bull market began in March 2009, which makes it almost 6 years old. The longer that this bull market runs past its historical average, the higher the likelihood that it will sell off and become a bear market. Current Statistics Indicate An Overvalued Market I’d love to say that I can predict exactly when the correction will happen, but I know that is a fool’s errand. I just know that the longer a trend continues in the stock market, the more people believe it to be true, which is ultimately when the sentiment changes. Robert Shiller, a renowned economist, created the Cyclically Adjusted Price-Earnings (CAPE) ratio in an effort to create a gauge of how expensive the current market is. It is tallied by dividing price by the 10 year moving average of earnings, adjusted for inflation. Check out the following historical CAPE chart for the S&P 500: S&P 500 Cyclically Adjusted Price-Earnings Ratio data by YCharts As you can see, we are currently at the same level that we were at during the peak of the 2008 market, and just under the level of the infamous 1929 crescendo. This does not mean that a crash is imminent, but it does mean that we are entering dangerous waters. Another tell tale sign of a roaring bull market is high speculation on margin. This chart shows an eerie correlation between stock prices and margin levels: (click to enlarge) Source: Business Insider As the famous Mark Twain quote goes, “history doesn’t repeat itself, but it does rhyme.” As stock prices keep increasing, people become more confident, and overextend themselves. It is a reality of the stock market today. Unless we are truly entering a fairy tale era of high margin speculation and never ending growth, this trend has to reverse itself eventually. Other Considerations The Federal Reserve has officially ended its unprecedented QE program, which has been the largest economic stimulus in world history. This is important because it is now only a matter of time before the Fed raises interest rates. It will be fascinating to see how the financial markets react to the inevitable rate hike. This will negatively impact earnings for thousands of companies that rely on borrowed money. When this happens, volatility will spike. From a macro perspective, it is a harsh reality that there is a tremendous amount of uncertainty in the world today. With Greece teetering on the edge of default and ISIS being in the news almost daily, there is high potential for a negative trigger sometime in the near future. Unfortunately, subprime lending is making a comeback and student loan debt is burdening an entire generation, causing first time home buyer rates to drop to 30 year lows . As the student loan generation ages, they will have less disposable income to spend, and thus will impact the revenues of many companies. All of these are potential catalysts that could trigger a long overdue negative reaction in the stock markets. Why Choose A Leveraged Fund? The reason I chose a leveraged ETF like UVXY rather than a standard futures ETF like the iPath S&P 500 VIX Short Term Futures ETF (NYSEARCA: VXX ) is simple: a strong conviction that the facts mentioned above will contribute to a market volatility higher than current levels in the near future. UVXY attempts to return 2x the VIX’s performance for that particular day. This means that when a spike in volatility occurs, UVXY will significantly outperform VXX, which only attempts to achieve 1x the VIX performance. Although UVXY will decline more than VXX in a low volatility market, the increased profit potential outweighs that drawback in my opinion. Risks There is one dominant risk concerning this strategy: the structure of UVXY itself. UVXY is a leveraged futures ETF, which means that it suffers exponential decay when in a period of contango. Contango is when the futures price is more expensive than the current spot price. Unfortunately, in a low volatility market like the present one, UVXY is in contango the majority of the time. Accordingly, the risk of holding UVXY for a long period of time should be obvious. It WILL lose money if the market keeps up its slow ascent and fear fails to materialize. However, history shows us that record high stock prices and low volatility cannot go on indefinitely. It is of utmost importance to exit a position in UVXY as soon as the VIX spikes in a significant way. Why is this? Because fear is a much stronger emotion than greed, but lasts for a much shorter time, which makes the spikes that much more pronounced. Accordingly, fear can vanish in an instant, so huge gains in a vehicle like UVXY can vanish in the blink of an eye. Conclusion Although the near future in stocks may continue to be bright, I believe that preparing for the worst is always a good strategy. As a holder of equities, I am hoping that the stock market continues its upward trend, but I will be prepared if it does not. I consider the decay of UVXY the monthly premium that I pay in order to hold insurance in the case of disaster. If any of the aforementioned negative triggers materialize, UVXY should increase in value, which will then allow me to add to my long positions at lower prices. As Warren Buffett is famously quoted: “Only when the tide goes out do you realize who’s been swimming naked.” All I know is that when the wave of fear hits, at least I’ll have my bathing suit on. Disclosure: The author is long UVXY. (More…) The author wrote this article themselves, and it expresses their own opinions. The author is not receiving compensation for it (other than from Seeking Alpha). The author has no business relationship with any company whose stock is mentioned in this article.

Will Yellen Move The Price Of SLV?

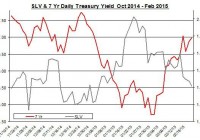
Summary The price of SLV fell down in the past week. Will Yellen’s testimony move the price of SLV? The rally in the U.S. treasury yields coincided with the drop in silver prices. The silver market cooled down in the past week as shares of the iShares Silver Trust ETF (NYSEARCA: SLV ) fell by 6%. For SLV, the upcoming testimony of Yellen and the latest developments in Europe could curb further down SLV. Yellen testifies Following the release of the minutes of the FOMC meeting, the upcoming testimony of FOMC Chair Yellen will take the center stage this week. Yellen will testify on Tuesday and Wednesday before the Senate Banking Committee and House Financial Services Committee, respectively. The latest minutes were perceived a bit dovish. After all, the probabilities of a rate hike have gone down a bit for both July and June compared to previous weeks. Because of the dovish tone in the minutes, some market analysts think that Yellen’s testimony will be a bit more hawkish – given the strong numbers presented in the latest non-farm payroll report, this scenario is plausible. But Yellen isn’t likely to rock the boat and reiterate that a decision on a rate hike will be data dependent. Since the FOMC is slowly adjusting the markets for a rate hike in the coming months, it’s unlikely that there will be a surprise or significant delay. This is true because central banks tend to “surprise the markets” and change the market expectations when it comes to stimulating the economy. When it comes to austerity and rate hikes, central banks tend to be much more cautious, prudent and give enough time for the market to adjust to the new policy. The biggest fear of a central bank is that its policy change will lead to an economic slowdown or even recession. Besides Yellen’s testimony, the second estimate of the U.S. GDP for the fourth quarter will be released on Friday. In the first estimate, the GDP growth rate was 2.6%, which was a bit lower than market expectations. If the GDP growth rate comes lower than current estimates, which are 2.1%, this news may bring back up the price of SLV. Another report worth considering is the U.S. CPI, which will be released this week. A drop in the core CPI could actually bring up SLV – this could revise down the FOMC’s inflation expectations. In the meantime, the recent developments in Europe may have also contributed to the weakness of SLV. Greece’s debt problem was defused, for now… One factor that could have had some indirect implications on the levels of risk in the financial markets, which may have benefited precious metals investments such as SLV, is the Greek debt problem and the possibility of a Greek exit from the European Union. The recent news from this front is that the Greeks have practically conceded to the Germans : The Greeks didn’t achieve too major goals to the austerity measures set in place. Greece received a four-month extension on its bailout. In exchange, on Monday, the Syriza-led government submitted its list of structural reforms that will need to be approved by the EU members. At least when it comes to the fiscal targets, the Greeks got a victory, and the budget surplus of 4.5% of GDP is on the table and the target could come down to 1.5% next year. These developments are likely to push away the whole Greek exit talk for the near term from the markets’ agenda. One of the main events of the week in Europe is the third tranche of the targeted LTRO. The last two auctions came short of market expectations. If this tranche also fails to reach high levels, then it could suggest the ECB may wish to expand its QE program. For SLV, lower risk in the financial markets could bring further down its price. One way is via the changes in the U.S. treasury yields. The sharp fall in U.S. long-term treasury yields at the beginning of the year changed course in recent weeks, as indicated in the chart below. Source: U.S. Department of Treasury and Bloomberg The linear correlation between SLV and U.S. long-term treasury yields isn’t strong at only -0.17 (for 7-year yields), but precious metals, especially gold, tend to have a strong relation with treasury yields. Nonetheless, the rise in U.S. interest rates, as the market expects a rise in the Fed’s cash rate in the middle of the year, could further contribute to the weakness of SLV. In the past week, the amount of silver ounces in SLV has picked up a bit albeit the silver ounces in this ETF are still down for the year. Source: iShares Silver Trust website It’s still unclear when, if at all, the FOMC starts to raise rates. For now, it seems that unless we will see a major change in the U.S. economic recovery, the FOMC will likely to raise rates in the middle of the year. Yellen’s upcoming testimony could provide some more insight about the next policy change, but I suspect this testimony, much like others in the past, won’t offer more than a general tone and “data dependency” policy. The recent diffusion of the Greek debt crisis is likely to curb down the demand for investments that are considered safe haven such as precious metals. For now, the possible upside for SLV is if the U.S. economy’s progress fails to meet market expectations (e.g. lower-than-anticipated growth in GDP or CPI). In such an event, SLV could rally, even if for a short term. For more see: Will Higher Physical Demand For Silver Drive Up SLV? Disclosure: The author has no positions in any stocks mentioned, and no plans to initiate any positions within the next 72 hours. (More…) The author wrote this article themselves, and it expresses their own opinions. The author is not receiving compensation for it (other than from Seeking Alpha). The author has no business relationship with any company whose stock is mentioned in this article.