Tag Archives: portfolio

REM Compared To Equal Weighted mREIT Portfolios
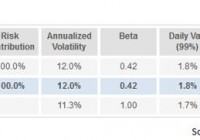
Summary REM holds up better than I would have expected. Market capitalization weighting is easy, but may be less than ideal for reducing risk. REM is compared over a two-year period and a one-year period against hypothetical mREIT portfolios built at equal weights. When I was taking a look at the iShares Mortgage Real Estate Capped ETF (NYSEARCA: REM ), one of my thoughts was that the portfolio would be more attractive with a different weighting scheme. My views on that have changed some since Annaly Capital Management (NYSE: NLY ) reported an excellent second quarter and its new strategy sounds much better . However, I still wondered from a risk-adjusted viewpoint how different an ETF might look if it held the same holdings, but applied an equal weight methodology rather than using market cap weights. The Benefits of Market Capitalization Weighting The biggest advantage to using market capitalization is that it is remarkably easy. The fund establishes the volume of assets and the total market cap of each company. They spend on the shares accordingly, and if they were not trying to grow assets in the ETF (to generate more fees), they would simply leave that same structure in place. The only modifications to be made would be to adjust for the new shares issued and old shares repurchased. In general, this is a very simple kind of ETF to run. The Problem When using market cap weighting, if a company becomes relatively overvalued, it is also likely to have a higher weight in the portfolio. Unless the overvalued status is coinciding with repurchasing shares to shrink the market cap, the weighting will grow. That is unfortunate. It also means a portfolio may have substantially less diversification if some holdings grow large enough to dominate a large chunk of the portfolio. Equal Weighting My theory was that even though smaller companies will on average be more volatile (as demonstrated in the charts I will provide), the benefit of better diversification could cancel out those effects. Equal weighting is rarely going to be the ideal method, but it provides a simple alternative to market capitalization. Findings I originally built a spreadsheet to run an analysis of correlations and simulate different portfolios, but I find the tools at InvestSpy.com were faster than running it through my spreadsheets. Therefore, I simulated the portfolios using its website. REM has a total of 39 holdings, but I ran my first comparison using only 20 mREITs. The names included several of the largest from the REM portfolio and some that I cover that are not given material weights in the portfolio. The analysis was based on comparing the last 2 years of returns. REM 2 Years (click to enlarge) The primary factor that I’m looking at here is that the annualized volatility of the portfolio is 12% and the beta is .42. I’m focused on testing for risk rather than testing for historical returns since using historical returns would create an enormous bias into the test, as I could simply avoid selecting mREITs that have cratered when designing my comparable 20 mREIT portfolio. Equal Weighted 20 The next table is going to be dramatically larger because it is showing the numbers for each individual mREIT. (click to enlarge) This portfolio made of 20 mREITs with equal weights shows a lower annualized volatility at 11.2%; however, it also shows a beta that is slightly higher at .43. I would say that given the sample size (only 2 years), the beta comparison is within the margin of error. Some other factors jump out when we look at this as well. The stock that generated the highest risk contribution was CYS Investments (NYSE: CYS ). It was not the highest volatility, it was not the highest beta, and yet it contributed the most to the portfolio. It also had one of the best return percentages. On the other hand, Blackstone Mortgage Trust (NYSE: BXMT ) delivered in every way. The risk contribution was low and the annualized volatility was the lowest within the group. Despite that, it had a total return of 31.2%, which should remind readers that not all risk and return tradeoffs are created equally. Both the highest-risk contributor and the lowest-risk contributor were near the top of the chart in their total return over the last 2 years. One-Year Comparisons The following chart has REM’s performance over the last year: (click to enlarge) For comparison, this time I wanted to replicate a larger portfolio, so I am only excluding one security from the portfolio. That security has a very short history and thus is not viable for the statistics. It should be noted that I have cropped the following image to make it substantially shorter since the site struggles with displaying longer charts. (click to enlarge) In this second comparison, there are about 37 mREITs all under equal weighting, but the annualized volatility for the portfolio is within a margin of error. In the context of a year, .1% is not reliable. Interesting Notes When I shifted to using 37 mREITs for the one-year measure, I was expecting it to result in a larger reduction in volatility, but it did not. It would seem the volatility of those smaller mREITs was enough to outweigh the benefits of more diversification. Investing in ETFs is generally relying on diversification within moderately efficient markets to be worth the costs. For the mREIT investor that has the best information, I don’t think the diversification is adding any advantages. However, for the mREIT investor who just wants to set it and forget it, the REM portfolio has done remarkably well. Comparison of Holdings The following chart shows the top 10 holdings of REM: (click to enlarge) As you can see Annaly Capital Management and American Capital Agency Corp. (NASDAQ: AGNC ) dominate the portfolio and combine to be over 26% of the portfolio value. Conclusion The way REM designs the portfolio is not perfect in my opinion; however, it is still done well enough to offer investors some fairly substantial reduction in risk. The expense ratio is high for my tastes at .48%, but at least investors are receiving a fairly substantial reduction in volatility, and when compared to other weighting methods, such as going equal weight, REM has done fairly well. If you are curious about the risk factors for REM, you’ll want to see my last piece on the ETF . Next time I cover REM I’m going to establish comparisons to the portfolio I would create if I were aiming to produce an ETF full of mREITs. Scroll up to the top of the article and hit the follow button so you don’t miss it. Disclosure: I/we have no positions in any stocks mentioned, and no plans to initiate any positions within the next 72 hours. (More…) I wrote this article myself, and it expresses my own opinions. I am not receiving compensation for it (other than from Seeking Alpha). I have no business relationship with any company whose stock is mentioned in this article. Additional disclosure: Information in this article represents the opinion of the analyst. All statements are represented as opinions, rather than facts, and should not be construed as advice to buy or sell a security. Ratings of “outperform” and “underperform” reflect the analyst’s estimation of a divergence between the market value for a security and the price that would be appropriate given the potential for risks and returns relative to other securities. The analyst does not know your particular objectives for returns or constraints upon investing. All investors are encouraged to do their own research before making any investment decision. Information is regularly obtained from Yahoo Finance, Google Finance, and SEC Database. If Yahoo, Google, or the SEC database contained faulty or old information it could be incorporated into my analysis.
A Well Designed High Yield Bond Fund: HYG

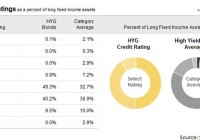
Summary The IShares iBoxx $ High Yield Corporate Bond ETF has the expected credit risk for a high yield fund, but the yield is worth it. The holdings show reasonable diversification in the debt securities in the portfolio. Maturities are scattered from 1 year through 10 years with the heaviest levels in the 5 to 7 year range. The correlation to SPY which causes the ETF to dip with the S&P 500 is a concern of investing in junk bond funds. The correlation issues should be less pronounced if investors include other (not junk, lower yield) bond funds in their portfolio. The iShares iBoxx $ High Yield Corporate Bond ETF (NYSEARCA: HYG ) is a solid bond fund for exposure to securities rated BB or B. As I’ve been searching for appealing bond funds, finding great ETFs for bonds of mediocre quality and higher yields has been difficult. After looking through the portfolio, I think the holdings are fairly reasonable for an investor wanting to regularly keep part of their portfolio in a bond fund. The holdings clearly don’t have impeccable credit ratings but they do offer investors a decent yield. The distribution yield is about 5.5% which means investors are actually getting some respectable income out a bond fund. Credit Quality When the name says “High Yield Corporate Bond”, investors should know that is going to mean that credit ratings won’t be very high. The allocation here seems within reason even if it is a little heavier on the specific ratings it targets than the category average. See the chart below: (click to enlarge) The concentration doesn’t bother me. If I’m going to invest in a credit sensitive bond portfolio I want the holdings to be diversified when considering the issuer of the debt, however having a heavy focus on the specific credit ratings is nice when an investor wants to build an entire portfolio and use multiple bond funds. Holdings I prepared the following chart showing the largest debt holdings of HYG. There were a couple equity holdings showing up but they were inconsequential to the overall portfolio as their combined value was significantly less than 1% of the portfolio. (click to enlarge) Maturities I grabbed another chart to show the maturity ranges across the portfolio: (click to enlarge) The maturity profile for the iShares iBoxx $ High Yield Corporate Bond ETF is fairly reasonable for an investor trying to get a solid diversification across the yield curve with a preference for shorter to medium length securities which should reduce the volatility of the portfolio. Of course, the credit risk on the portfolio could be an issue for some investors and may influence volatility in its own way. Regardless, the portfolio is showing almost no exposure beyond 10 years while having a solid yield. When it comes to maturities, I think this breakdown looks fairly solid. Risk HYG has been around since early 2007 which is wonderful for seeing how the fund did during that challenging period that followed. The shares did drop hard along with the market, which is not surprising given that they are investing in high yield (and thus higher risk) securities, however it did not fall even remotely as hard as the S&P 500. The biggest risk factor from a portfolio standpoint that came up for me was a 73.8% correlation in monthly returns with the S&P 500. Since one purpose of the bond portion of the portfolio is to provide diversification, it is a strike against junk bond funds that they tend to move with the market. That is a problem that should be impacting most junk bonds though, not a risk unique to HYG. Expense Ratio The one thing I really don’t care for is the expense ratio at .50%. I’m not going to say that this is terrible for a bond fund, but my expectations for low expense ratios are not met. Conclusion HYG is a fairly solid option for junk bond exposure. The portfolio appears to be designed well, the distribution of maturities works to help avoid excessive exposure to a single part of the yield curve and the portfolio produces a respectable amount of income. I could go for a lower expense ratio to really make this fund stand out, but that is the only weakness I see that is specific to the fund. If an investor is looking at the role of the bond fund in their portfolio, it would be wise to consider having multiple bond funds if the first one is going to be investing in junk bonds. This kind of fund can offer some diversification benefits to investors but it would be most productive in a portfolio that combines it with a few other bond funds with different duration exposures and higher credit ratings to enhance the diversification benefits that bonds bring to the investor’s portfolio. Disclosure: I/we have no positions in any stocks mentioned, and no plans to initiate any positions within the next 72 hours. (More…) I wrote this article myself, and it expresses my own opinions. I am not receiving compensation for it (other than from Seeking Alpha). I have no business relationship with any company whose stock is mentioned in this article. Additional disclosure: Information in this article represents the opinion of the analyst. All statements are represented as opinions, rather than facts, and should not be construed as advice to buy or sell a security. Ratings of “outperform” and “underperform” reflect the analyst’s estimation of a divergence between the market value for a security and the price that would be appropriate given the potential for risks and returns relative to other securities. The analyst does not know your particular objectives for returns or constraints upon investing. All investors are encouraged to do their own research before making any investment decision. Information is regularly obtained from Yahoo Finance, Google Finance, and SEC Database. If Yahoo, Google, or the SEC database contained faulty or old information it could be incorporated into my analysis.

What To Do When Financial News Headlines Jump Out At You

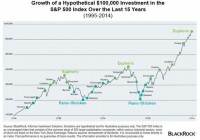
I’ve written about how my aunt calls me when the markets worry her. Needless to say, she’s been calling a lot. Rising interest rates. Sinking oil prices. A strong dollar and weak earnings. Greece, China and Puerto Rico. The news headlines make hay of these swings, and investor emotions can ride along with the dramatic stories. The stock market will spike one day, you feel optimistic and invest, then the market drops back down the next day. Earlier this year, we talked about how the markets would seem more volatile than in recent past. Well, they have delivered on that forecast. After years of relative calmness and steadily rising returns, markets have been jumpier lately. (click to enlarge) Turn your gaze away from the headlines, and instead, take a good look at your investments. It is what you do within your portfolio that matters. Here are four strategies to help your investments navigate the turbulence: Diversify . Market cycles typically move in different patterns. I will save you the academic rationale, but you may want to have some investments zig while others zag. This is the crux of what we call diversification. So the most important way to manage portfolio risk overall is to diversify across stocks, bonds, geographic regions and sectors. Getting this mix right is really important. If you’re new to investing, a low-cost way to achieve a balanced portfolio in one single trade is through a diversified iShares Core Allocation exchange traded fund (ETF). If you already have an established portfolio, review your holdings regularly and talk to your financial planner about diversifying. Go min vol . If you want broad market exposure with potentially less risk, minimum volatility ETFs might be a good fit. These funds seek to track market indexes with a mix of historically less volatile stocks, so you can still invest in global, U.S., developed international and emerging markets with potentially fewer bumps in the road. Bargain shop . Who doesn’t like a good discount? Truth is many U.S. stocks have gotten quite expensive , and it has been harder and harder to find true value. So when the market drops, it can be a great buying opportunity. Talk to your planner about potential deals in the market that can complement your long-term portfolio. Stay put . If your investments are in good shape, make no sudden moves. Over time, markets tend to balance out, and you’re likely to do better staying invested in a diversified portfolio than engaging in frenzied, sometimes expensive, trades. As I do with my aunt, work your way through the four steps above to ensure your investments are sturdy. Successful investors don’t panic over headlines. They stay educated and stay invested. Learn more about what to know and what to do from the mid-year update of The BlackRock List , and get back to enjoying your summer. Original Post Share this article with a colleague