Tag Archives: nysearcausmv

U.S. Stocks And U.S. Bonds: What The Heck?

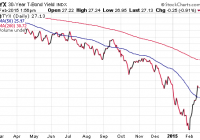
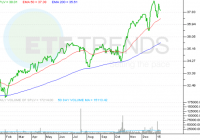
It is hard to believe just how many folks expect the U.S. stock market to rise substantially in the current environment. U.S. stocks and U.S. bonds are extremely overvalued. As long as one has a plan for exiting – rather than foolishly hoping-n-holding – one is able to minimize the risk of remaining invested in overvalued equities. Most people believe that Tom Cruise became an international superstar with the release of the action drama, “Top Gun” back in 1986. However, I remember the actor from an earlier film, “Risky Business.” The popular motion picture capitalized on teenage angst and harebrained ways to make money. In the film itself, the main character, Joel Goodson, turns his family home into a house of ill-repute to finance the repairs of his father’s Porsche – a car that he had been warned not to use, yet inadvertently destroyed. By the end of the movie, increasingly perilous behavior helped Joel get into Princeton, as opposed to him following a straighter-and-narrower path. Fans may recall the risk-taking tagline, “Sometimes you just gotta say, ‘What the Heck.'” In Hollywood, at least for the sake of on-screen comedy, irrational audacity may prove rewarding. In real life, however, investors tend to be compensated for taking reasonable risks. Granted, speculators can sometimes profit from bizarre decisions. Yet an investor who allows over-the-top exuberance to cloud sound judgment typically gets battered by panicky reversals of fortune. Indeed, it is hard to believe just how many folks expect the U.S. stock market to rise substantially in the current environment. Companies are not selling as much as they had anticipated as shown by rising manufacturer, wholesaler and retailer inventories. Companies in the S&P 500 are not profiting as much as executives had hoped either; analysts have been dramatically ratcheting down earnings expectations. Meanwhile, the parade of weak economic reports continue to flow in, from producer prices (excluding food and energy) registering an unexpected decline to smaller-than-expected gains in industrial production. Downward revisions to gross domestic product are a near certainty. What are the implications for the investing public? Sadly, it is a world where the two primary asset classes stateside – U.S. stocks and U.S. bonds – are extremely overvalued. And yet, the choices of how to manage the overvaluation in one’s portfolio are not particularly attractive either. Since there are no meaningful risk-free rates of return in a zero percent interest rate environment, investors have been choosing between risky and riskier alternatives. In one corner, expensive U.S. stocks may continue to appreciate on additional corporate buybacks as well as the possibility of economic acceleration. In the other corner, appallingly low-yielding U.S. bonds may produce total returns that exceed stocks due to the former’s relative value against developed world bonds; most of the developed world’s fixed-income yields are noticeably lower than comparable U.S. maturities. Of the two alternatives, I am still favoring long-term U.S. treasuries in client portfolios. The German 30-year bund yield is under 1%, while the Japanese 30-year is near 1.5%. As silly as those yields are, they are not likely to rise appreciably when the Bank of Japan (BOJ) and the European Central Bank (ECB) are in early stages of bond buying via quantitative easing exercises. Even more alarming? The 30-year yields for France, Canada and Italy are 1.45%, 2.12% and 2.61% respectively. We’re talking about fiscally irresponsible Italy having a lower yield than the U.S. at 2.71%. Does it not make sense to consider long-term U.S. bond exposure via the Vanguard Extended Duration Treasury ETF (NYSEARCA: EDV ) or the PIMCO 25+ Year Zero Coupon U.S. Treasury Index ETF (NYSEARCA: ZROZ ), especially when the 30-year yield has reverted back to a 50-day moving averages? Buying bond dips can be as rewarding as buying stock dips. The increasingly unattractive prospect of robust exposure to U.S. stocks has not kept me from sticking with the trends. My clients will continue to own funds like the iShares S&P 100 ETF (NYSEARCA: OEF ), the Health Care Select Sect SPDR ETF (NYSEARCA: XLV ), the Vanguard Mega Cap Growth ETF (NYSEARCA: MGK ) as well as the iShares MSCI USA Minimum Volatility ETF (NYSEARCA: USMV ) until there is a significant breach of the 200-day moving average on the downside. What-the-heck pricey? You bet. On the other hand, the market can remain insanely effervescent for a whole lot longer than an investor can accept 0% in a money market. As long as one has a plan for exiting – rather than foolishly hoping-n-holding – one is able to minimize the risk of remaining invested in overvalued equities. It is important to recognize, though, that stock uptrends in foreign markets come with lower P/E price-tags. Conservatively speaking, developed world stock assets trade at a 10%-15% P/E discount to the U.S., while broad-based emerging market stock assets may be trading at a 20% to 25% discount. It has been more difficult for me to embrace either the Vanguard FTSE Europe ETF (NYSEARCA: VGK ) or the Vanguard FTSE Emerging Markets ETF (NYSEARCA: VWO ) yet, as both have resistance at their respective 200-day trendlines and both do not have the currency-hedged exposure that I prefer at this moment. In contrast, I have advocated for several months on behalf of the iShares Currency Hedged MSCI Germany ETF (NYSEARCA: HEWG ) on the expectation that as the most successful exporter in the region, Germany will benefit the most from the battered euro. What’s more, HEWG’s uptrend is intact. Disclosure: Gary Gordon, MS, CFP is the president of Pacific Park Financial, Inc., a Registered Investment Adviser with the SEC. Gary Gordon, Pacific Park Financial, Inc, and/or its clients may hold positions in the ETFs, mutual funds, and/or any investment asset mentioned above. The commentary does not constitute individualized investment advice. The opinions offered herein are not personalized recommendations to buy, sell or hold securities. At times, issuers of exchange-traded products compensate Pacific Park Financial, Inc. or its subsidiaries for advertising at the ETF Expert web site. ETF Expert content is created independently of any advertising relationships.

Low-Volatility ETFs Outperform In Shaky Market Conditions

Summary Volatility in the markets is rising. Low-volatility stock ETFs are outperforming. A closer look at two low-vol ETFs. Low-volatility exchange traded funds that have taken a more cautious approach have outperformed the broader equities market as short-term concerns unbalanced stocks’ march upward. Over the past year, the PowerShares S&P 500 Low Volatility Portfolio ETF (NYSEArca: SPLV ) gained 19.2% and iShares MSCI USA Minimum Volatility ETF (NYSEArca: USMV ) rose 18.2%. Year-to-date, SPLV was up 0.1% and USMV was 0.5% higher. In contrast, the S&P 500 index increased 13.5% over the past year and fell 1.7% year-to-date. Market volatility is spiking as concerns mount over the potential effects of a plunge in crude oil prices. The CBOE Volatility Index, or VIX, closed at 21.6 Wednesday, compared to its historical range between 15 and 20. The VIX, a gauge of demand for protection against losses in U.S. equities, has oscillated more than 10% in three trading sessions since December 31. “Every time oil goes down into a new range, those fears reignite,” Paul Zemsky, head of multi-asset strategies at Voya Investment Management LLC, said in a Bloomberg article. “Will something happen in Russia? Will a hedge fund blow up? Which banks will get hammered by this?” However, a rise in volatility has helped the least volatile stocks standout. Moreover, low-volatility equities are experiencing greater demand due to low interest rates. Traditionally, investors would turn to fixed-income assets to diminish risk exposure. However, with rates more likely to rise and the U.S. economy expected to continue expanding, investors have turned to low-volatile stock options to capture a growing equities market and to hedge some of the market risks. For instance, both SPLV and USMV overweight outperforming defensive sector stocks. Specifically, SPLV includes a 20.2% tilt toward health care and 16.0% in consumer staples. USMV has 18.4% utilities and 15.6% consumer staples. Both ETFs also underweight the energy sector, the worst performing area of the market. SPLV takes 100 stocks from the S&P 500 that have exhibited the lowest volatility over the past year and weights holdings by the inverse of their volatility, so the largest components show the least amount of volatility. USMV also tracks low volatility stocks, but the ETF targets variances and correlations for all stocks, along with other risk factors. PowerShares S&P 500 Low Volatility Portfolio (click to enlarge) Max Chen contributed to this article .

Minimum Volatility Stocks: Out-Of-Sample Performance Of USMV Buy & Hold Models

Originally published on Dec. 16, 2014 The backtest reported in this article showed that ranking the holdings of USMV , the iShares MSCI USA Minimum Volatility ETF, and selecting a portfolio of the 12 top ranked stocks, provided higher returns for the buy & hold portfolio than for the underlying ETF. To test these findings out-of-sample we launched the Best12[USMV]-July-2014on Jun-30-2014 and the first sister model Best12[USMV]-Oct-2014 on Sep-29-2014. Holdings and performance have been published weekly on our website since then. So far to Dec-15-2014 these portfolios have gained 19.2% (6.8%) and 10.5% (5.3%), respectively. (USMV gains are in brackets.) The test will be expanded by the launch on Jan-5-2015 of the second of the three sister models quarterly displaced, the Best12[USMV]-Jan-2015, which again will consist of the 12 highest ranked stocks of the then point-in-time holdings of USMV. Eventually there will be four quarterly displaced Best12[USMV] models at iMarketSignals to check whether the out-of-sample [OOS] performances of the models exceed those of USMV over the same periods. Only when the OOS periods are long enough can one decide whether this is a profitable investment strategy. One can probably assume this to be the case if by the end of next year the combined returns of the models are indeed significantly higher than the combined returns of USMV for the corresponding periods. Although the performance of the two models have been considerably better than that of USMV, one should not commit capital in the expectation that strategies that worked well in-sample, and for a few months OOS, are therefore also bound to do well in the future. Backtest Parameters It is relatively simple to “overfit” an investment strategy so that it performs well in-sample, but the more complex a model is, the higher the likelihood of the OOS performance to underperform the backtest’s results. Therefore a simple algorithm with only a few parameters was chosen, with buy- and sell rules kept to a minimum, details of which were provided in the original article. The model should also be tax-efficient because the holding period for each stock will normally be at least one year long. Current Holdings and Return to Dec-15-2014 for Best12[USMV]-July-2014 Of the portfolio’s initial holdings of 12 stocks, 11 of them gained value since inception on Jun-30-14, with the portfolio showing a 19.23% return to Dec-15, while iShares’ USMV gained 6.77% over the same period. A starting capital of $100,000 at inception grew to $119,230, with fees and slippage accounted for. Table 1 below shows the current holdings, unchanged since inception, and return for each position. (click to enlarge) (click to enlarge) The performance graphs of $100 invested in the Best12[USMV] and SPY (the ETF tracking the S&P500), is shown below, with the red graph indicating the value of Best12[USMV]-July-2014 and the blue graph depicting the value of SPY. (click to enlarge) (click to enlarge) Current Holdings and Return to Dec-15-2014 for Best12[USMV]-Oct-2014 Of the portfolio’s initial holdings of 12 stocks, 11 of them gained value since inception on Sep-29-14, with the portfolio showing a 10.53% return to Dec-15, while iShares’ USMV gained 5.30% over the same period. A starting capital of $100,000 at inception grew to $110,530, with fees and slippage accounted for. Table 2 below shows the current holdings, unchanged since inception, and return for each position. (click to enlarge) (click to enlarge) The performance graphs of $100 invested in the Best12[USMV] and SPY (the ETF tracking the S&P500), is shown below, with the red graph indicating the value of Best12[USMV]-July-2014 and the blue graph depicting the value of SPY. (click to enlarge) (click to enlarge) Following the Models At our website, the weekly performance update could be followed already from July 2014 onward. It was originally predicted that a 12-stock model should outperform USMV, which the results of the July and October models so far confirm. (The weekly updates can also be viewed by non-subscribers to iM in the archive section, delayed by a few weeks.) To track performance over an extended OOS period we will be adding, additional to the Jul-2014 and Oct-2014 models, another two similar models, the Jan-2015 and Apr-2015 models. At inception each model will have a 12-stock portfolio selected from the point-in-time holdings of USMV. The universe from which stocks are selected will be updated every three months for each model with the universe corresponding to the then current holdings of USMV. Current holdings of the models, which may not be included in the new universe, will be added to the universe. This will ensure that stocks are not sold because they may be omitted from future holdings of USMV, and the models can keep their holdings for at least one year as stipulated by the sell rules. It is expected that by April 2015 the combined stock holdings of the four models will be about 20% of the holdings of USMV, about 30 different stocks. The portfolio is expected to show better returns than USMV, provided that the OOS performance continuous to confirm the backtest’s results. Appendix Combined Holdings The combined models hold 18 different stocks of which 6 are represented in both models as shown in the table below. Combined Holdings of Best12(NYSEARCA: USMV )-July and Best12( USMV )-Oct Ticker Nr. of times in combination Sector AZO 1 Consumer Discretionary BBBY 1 Consumer Discretionary DG 2 Consumer Discretionary DLTR 1 Consumer Discretionary ROST 1 Consumer Discretionary CVS 1 Consumer Staples PRE 1 Financials TRV 1 Financials Y 1 Financials CAH 2 Health Care ESRX 1 Health Care MDT 1 Health Care LMT 1 Industrials LUV 2 Industrials MMM 1 Industrials PCP 2 Industrials EBAY 2 Information Technology SNPS 2 Information Technology