A 10-Bagger Emerges
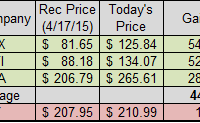
All of my investments fall into two* broad categories: Category 1: Dividend and Dividend Growth Unexciting and established companies that pay out consistent, rising dividends that provide passive income and bring me closer to my financial independence. Companies like: HCP, Inc. (NYSE: HCP ), Johnson & Johnson (NYSE: JNJ ), Textainer (NYSE: TGH ), Philip Morris (NYSE: PM ), National Oilwell Varco (NYSE: NOV ), or PepsiCo (NYSE: PEP ). Category 2: Game Changers Exciting, emerging companies that I invest in to be part of a greater story, trend, and idea and to make huge amounts of capital gains over the course of years. Companies like: Netflix (NASDAQ: NFLX ), SolarCity (NASDAQ: SCTY ), LinkedIn (NYSE: LNKD ), or Google (NASDAQ: GOOG ) (NASDAQ: GOOGL ). *: Some companies fall into both categories; a sweet spot of having high growth prospects while still paying a dividend. Companies like: Visa (NYSE: V ), Costco (NASDAQ: COST ), Apple (NASDAQ: AAPL ), Starbucks (NASDAQ: SBUX ), or Texas Roadhouse (NASDAQ: TXRH ). All of the companies I’m invested in can be found at my portfolio . The rest of this post is about Category 2. Status Of Our Current Ten-Bagger Candidates Three months back, I wrote this post identifying three stocks (Netflix, Bank of Internet (NASDAQ: BOFI ), and Tesla (NASDAQ: TSLA )) that will be ten-baggers over the next five to ten years. Since that time, each of those companies has gone gangbusters, trouncing the S&P 500 (prices through 8/5/2015): Weeehoo! I’m lucky that I’m able to show strong gains right out of the gate. Normally, I spend years defending my picks until I’m finally vindicated. That could still be the case for these companies, but the instant returns give me some street cred. People still scoff at my rather simple investing strategy , which would make sense if there was a correlation between intelligence and investment returns, but as we’ve seen , there is not. There seems to be a mindset that if you look at something in a “common sense” way, rather than get into this sort of craziness , then you obviously aren’t doing enough research. I disagree. I like to think of my investing approach as the Occam’s Razor of investment strategies, in that the most obvious idea is most likely the right one. In just the last three and a half months, a lot has gone right for these three 10-baggers, which have averaged 45% returns, crushing the S&P’s 1.6% return over the same period. Netflix: Netflix crushed subscriber estimates when it reported Q2 two weeks ago, adding 3.3M subs against estimates of 2.5M. Most astounding is that the domestic segment was about half responsible for that sound beating. So much for saturation… as Netflix added twice as many domestic subscribers this quarter versus the same quarter a year ago. The 7-for-1 stock split has helped as well, allowing retail investors to build a position in the previously pricey name, and even allowing yours truly to write a covered call on about half of my shares after the quarter was announced. I wrote a Sep 18, ’15 $125 call for $2.54 right after earnings; that call is trading at $1.87 now, so I’m up about $70. It’s small change, but I don’t see a lot more near-term catalysts that aren’t already baked in, so I’ll collect that whole premium if Netflix rises less than a few percent in the next month and a half. I’ll take that. I’m leery to cap my returns on Netflix with a long-dated option, but the premiums were still compelling at such high and near strikes that I couldn’t resist a little easy money. Things couldn’t be more exciting for Netflix right now. Japan, Spain, Portugal, and Italy will have Netflix streaming in the next three months, then we’re talking dozens more countries next year. The number of levers Netflix can pull are astounding, 4k streaming upgrades, mobile-only packages in emerging markets, merchandising, international syndication, and marketing of their original content. Oh, and that original content, it’s not just the dual world-beaters of House of Cards and Orange is the New Black anymore. Daredevil is being called the best superhero series of all time (I agree), and if you haven’t seen The Unbreakable Kimmy Schmidt, then you are missing out on the funniest thing since Parks and Rec. Just own this company. Stop overthinking it. Bank of Internet: Business as usual at our favorite branchless bank. They reported last week that the loan portfolio grew 40% yoy, and the industry-best loan loss provision continues to fall (just 0.62% now) – seriously, I’ll argue that these guys have the best underwriting of anyone (that isn’t out breaking thumbs) in history. The deposit base grew 46% yoy, but the best part is that cheap deposits (checking and savings) now account for 82% of deposits (from 74% last year) – that is awesome. That just keeps allowing BOFI to have a crazy NIM (net interest margin) of 3.82%. For a company that just grew full year EPS by 40%, a 22 P/E is just criminal, not to mention the fact that BOFI is still a tiny minnow ($1.9B market cap) in the ocean of financial industry. So, we have a small bank with revolutionary business model and absurd efficiency. Check. Best in sector loan losses and interest spreads. Check. Growing at an astounding rate and growing in the right areas. Check. You need to own this company. It will be a household name in ten years. Tesla: My man-crush Elon Musk is still cruising along at the world’s coolest technology/car company. In the last few months, Tesla has reaffirmed the Model X delivery schedule , with X deliveries coming in late September/early October. Musk called demand for Tesla’s new home battery storage unit, Powerwall, “crazy off the hook,” and said that they are basically sold out for 12 months and will have no way of meeting demand without the gigafactory. Speaking of the gigafactory, it will be producing batteries by the middle of next year. I want you to just imagine, for a second, what Tesla might look like in 2025. We could be talking about a company that is in nearly every garage in America – not the car, but the Powerwall. The economics of Powerwall are just too compelling. You charge your Powerwall at night with cheap energy, then during the day you’re powering your household/business using that cheap energy storage. Right now, the unit costs $4k including installation, but battery costs trend downward over time, and are expected to fall 7.5% every year for the next decade. In ten years, it will likely be $1.5-2k or less. Suddenly, it’s a no brainer. Maybe you’re saying, “Yah, but anyone can build a big battery.” Really? No, they can’t. After the gigafactory is built, the Tesla-Panasonic partnership will have over half the world’s lithium-ion battery production capacity. Of course, that’s just Tesla’s little Powerwall side hustle. Tesla will have the Model S, X, and III. Maybe a new Tesla Roadster . Then, leveraging this technology, why not a pickup truck? Vans? Name an automobile type, and it may be a Tesla opportunity. I don’t know everything, but I can say with a high degree of certainty that Tesla will keep innovating, and keep offering the best cars on the planet . If Tesla is still around in ten years, it can only be as a huge company – there is no middle ground. I think it will be around. A Fourth 10-Bagger Opportunity You didn’t think today’s post was to just take a victory lap, right? Heck no! Today, I am unveiling my fourth ten-bagger opportunity. Part of being taken seriously is to limit the number of recommendations you make. There’s no shortage of ideas out there, so it’s important to have each recommendation mean a lot. Once you start making ten or twenty recommendations a day, well… then you start sounding like Jim Cramer. But, by making only one big recommendation every few months, and just pounding the table on that same stock for years, you establish credibility through consistency. So, I don’t come to this pick lightly. In fact, I wrote about 15-inches of webspace on a totally different company a few weeks ago, thinking it was my next ten-bagger. But, after much consternation, I decided to withhold it because I just didn’t believe I had a high enough conviction. I have a very big internal hurdle I have to clear before I call something a ten-bagger. With that, let’s go. And to reveal, let me give a brief history… Three years ago, I came across this company called Mako Surgical. It was a robotic medical device maker that specialized in a robot called Rio, which did partial knee replacements and resurfacing. The device was approved by the FDA, and the Rio was expanding applications to hip replacements, as well. This was amazing. Now, rather than a surgeon goin’ in with a nice long incision and swapping a ball bearing in for your bad knee, the Rio made minimally invasive knee resurfacing possible. Cheaper cost. Shorter recovery times. Few complications or infections. Lots of stair-stumblin’ baby boomers hittin’ old age. A slam dunk. I already had a two-bagger and was pumping this company to all of my friends (I still have text messages to prove it). My belief was that I was looking at a powerhouse company like Intuitive Surgical (NASDAQ: ISRG ), but much earlier in the growth curve. Then, in September of 2013, it all came to a halt. Stryker (NYSE: SYK ), the major medical device company, announced they were acquiring Mako at a big premium. I couldn’t believe it! Yes, I was making a nice overnight profit, but I knew I would be losing out on years of much bigger gains. Since that point, I’ve been on the lookout for a similar opportunity. It’s been elusive, but I think I’ve found it. Enter, Zeltiq Aesthetics (NASDAQ: ZLTQ ). What is it? Zeltiq is a medical device technology company that is the exclusive licensee for the CoolSculpting System. Around 375,000 people in the U.S. each year get liposuction. This highly invasive procedure involves opening up a gap between the skin and muscle tissue and vacuuming out fat cells. Bruising is heavy, infection is common, it is quite expensive at roughly ~$5k per procedure (varies wildly based on extent, geography, body area, etc.), and requires a serious time commitment and work loss. CoolSculpting is a lighter, non-invasive take on liposuction. In fact, the technical term for a CoolSculpting procedure is cryolipolysis. If you break down that term: Cryo: Freezing, Lipo: Fat, and Lysis: Breaking down cell structure. The CoolSculpting procedure, in general, is as follows: A suctioning device is affixed to an area of a body that has the undesired fat tissue. Not “obese”-level fat tissue, but just that stubborn fat that hangs around areas like the lower abdomen, inner thighs, obliques, underarms, or back. Call it “pinchable fat.” While simultaneously suctioning, the device cools the area down to about 5 degrees Celsius (40 degrees Fahrenheit). The device stays on for about 60 minutes, wherein patients experience no pain, but some slight discomfort. The fat cells crystallize, with the onset of apoptosis. Over the course of the next 2-3 days, the fat cells collapse and die. Over the next 60-90 days, the amount of time needed to see complete results, macrophages begin to digest the dead fat cells and the body naturally processes them out. This is all FDA approved, and Zeltiq has recently been approved for several additional applications, including a lower temperature PRO device that speeds up the procedure, as well as a device currently awaiting FDA approval, the CoolMini, for removal of under-chin fat. Zeltiq recently was approved for use of the CoolSmooth, which is a non-suctioning device that works for “non-pinchable” fat. The procedure works using the same principle (although taking a bit longer), and treats areas like the outer thighs and stomach. A Preferred Alternative In a society where we’re looking for a fast-food, Persian Bazaar solution to all of our problems, this type of procedure hits a sweet spot. I see this as an opportunity to be at the early stages of the next Botox or Lasik. First, the cost. A 60-minute single-site session will run a patient around $500 (lower abdominal more like $800). Depending on the amount of fat to be removed, several sessions may be necessary. Zeltiq receives $125 per procedure ($275 for lower abdominal CoolMax procedures). Most patients receive ~4 procedures in total. This is a vanity treatment, but one that most Americans can choose to afford. Second, the non-invasiveness. It is a much lower mental hurdle for a person to overcome to receive an outpatient, 60-minute treatment that costs about the same as a good teeth-whitening. This procedure isn’t meant for very obese people, but for those who work out and just have a few troublesome areas (just about everyone), then this is a very viable option. Third, the positive side effects. It would do an investor well to review real patient stories and pictures both at the Proven Results section of the company website, as well as the CoolSculpting section of the independent reviews site RealSelf. However, you’ll note that the procedure has positive effects for skin tightening, stretch marks, or cellulite. While these are not the intended need, this is obviously a positive secondary outcome. The Market Here’s where we start talking about the 10-bagger opportunity. Zeltiq is growing rapidly, with revenues just being guided higher at a 40% increase year over year. In a razor and blades model, the company makes its money through the sale of machines and consumables. The company sold 387 machines (selling price when undiscounted is $109k) in the most recent quarter (86% YoY growth). The machine has a 55% gross margin. Consumables (applicators, gels, liners, and the $125 or $275 a pop procedure cards) were up 50% YoY with an 85% gross margin. Consumables now make up about half of all revenues, and that share is increasing (long-term target share is 70% of revenues are consumables). Perhaps most telling is that about 26% of all system sales were in international markets, but more importantly, 36% of all system sales went to existing accounts, or accounts that already had at least one system. How telling is that? Over a third of your system sales are to aesthetic clinics that already have at least one other > $100k machine on the premises. That’s some true demand driven sales! The market opportunity is immense. The company currently has about 3,200 accounts, which addresses about 10% of the U.S. market of aesthetic clinics and about 6% of the international market. The U.S. market and the international market are estimated to be roughly the same size. In terms of procedures, Zeltiq believes they are at about 2% penetration in the U.S., and 1% worldwide penetration. And as far as sustainability, I see underlying macro-trends like the widening belt of America as a rather strong wave to ride. The Opportunity Zeltiq currently trades at a P/E of 288 (EPS of $0.12). Nearly everyone would look at that P/E and just run for the hills. Keep in mind, though, that the 288 P/E is the last 12 months of earnings. Over the next three years, at consensus EPS estimates, the P/E will fall to 108, 48, and 26, respectively. Suddenly, a company that is more than doubling EPS YoY looks remarkably cheap. Especially considering the number of levers it can pull to drive earnings in a sustainable way. Zeltiq is targeting one new innovation per year, be it an applicator, device, or site. Thus far, they’ve shown remarkable success in navigating FDA waters, and there’s a high likelihood that CoolMini (under-chin fat) will be approved this fall. Additionally, Zeltiq is selling into their channels in a great, partnering way. They’ve opened two CoolSculpting Universities (east and west coast), with plans for three more. Classes fill up “months” in advance, and clinics that attend see an increase of 60% in system utilization. For a company so young and early in its growth curve, you can play with numbers in a lot of ways to come up with a path to ten bags. However, if we go with management’s target of 20% revenue CAGR for the next 5 years (a revenue growth rate that they’ve absolutely obliterated for the last few years), then we’re at $550M in revenue in 2020. At a 22% net margin (same as ISRG, but consistent with targets of 27% EBITDA margin and 5% target for Dep/Amort) then we have net profits in 2020 of $120M for a company growing at 20% YoY. Throw a 25 P/E on there and you have a $3B company, which would be a 130% increase from today, and still growing at 20%. I see that figure as base case. There is tremendous potential to expand this system for uses beyond fat removal (see investor presentation, below). Additionally, the global potential (100x in procedures) is off the charts, and that is against a backdrop of increasing emerging market incomes and tastes. It’s all really, really exciting to me. In Conclusion I am long the stock as of a few days ago. And because you can never trust anyone on the internet, I would strongly suggest reading, bare minimum, the following: I’m really excited to talk about this company alongside proven successes Netflix, Tesla, and Bank of Internet. I very honestly think that we’re looking at a technology that will gain widespread acceptance and use among not only our own population, but the global population over the years to come. With 2015 being Zeltiq’s first year of projected profitability, I think it’s an absolutely phenomenal time to throw just a little bit of money at this one while the elevator is still near the ground floor. Lastly, I don’t work for Zeltiq, there are no affiliate links or anything in this post, I literally make zero profit or money from anyone taking this advice. I understand that there’s some inherent skepticism in reading stuff on the internet, and that’s why I’m recommending doing your own further reading. There are some obvious risks, here, including loss of capital. So, if you do start a position, make it small. If Zeltiq fails, a little is all you’ll lose. If Zeltiq succeeds, a little is all you’ll need.