Tag Archives: management

Ivy Portfolio February Update

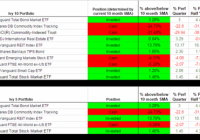
Scott’s Investments provides a daily Ivy Portfolio spreadsheet to track the 10 month moving average signals for two portfolios listed in Mebane Faber’s book ‘ The Ivy Portfolio: How to Invest Like the Top Endowments and Avoid Bear Markets ‘. Faber discusses 5, 10, and 20 security portfolios that have trading signals based on long-term moving averages. The Ivy Portfolio spreadsheet tracks the 5 and 10 ETF Portfolios listed in Faber’s book. When a security is trading below its 10 month simple moving average, the position is listed as “Cash”. When the security is trading above its 10 month simple moving average the positions is listed as “Invested”. The spreadsheet’s signals update once daily (typically in the late evening) using dividend/split adjusted closing price from Yahoo Finance. The 10 month simple moving average is based on the most recent 10 months including the current month’s most recent daily closing price. Even though the signals update daily, it is not an endorsement to check signals daily or trade based on daily updates. It simply gives the spreadsheet more versatility for users to check at his or her leisure. The page also displays the percentage each ETF within the Ivy 10 and Ivy 5 Portfolio is above or below the current 10 month simple moving average, using both adjusted and unadjusted data. If an ETF has paid a dividend or split within the past 10 months, then when comparing the adjusted/unadjusted data you will see differences in the percent an ETF is above/below the 10 month SMA. This could also potentially impact whether an ETF is above or below its 10 month SMA. Regardless of whether you prefer the adjusted or unadjusted data, it is important to remain consistent in your approach. My preference is to use adjusted data when evaluating signals. The current signals based on January’s adjusted closing prices are below. The spreadsheet also provides quarterly, half year, and yearly return data courtesy of Finviz : (click to enlarge) I also provide a “Commission-Free” Ivy Portfolio spreadsheet as an added bonus. This document tracks the 10 month moving averages for four different portfolios designed for TD Ameritrade, Fidelity, Charles Schwab, and Vanguard commission-free ETF offers. Not all ETFs in each portfolio are commission free, as each broker limits the selection of commission-free ETFs and viable ETFs may not exist in each asset class. Other restrictions and limitations may apply depending on each broker. Below are the 10 month moving average signals (using adjusted price data) for the commission-free portfolios: (click to enlarge) (click to enlarge) Disclosures: None Share this article with a colleague

European QE: Implications And Investment Opportunities

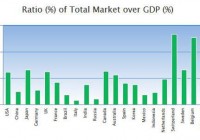
Summary The European QE, while beneficial, will have different impact and consequences than the US and the UK style QE. The retail European market is not as well developed as in the US, UK so the main risk asset likely to benefit from a large QE will be real estate. Countries with largest equity markets to GDP like the Netherlands, Belgium, France and Spain will benefit disproportionately from a risk on equity trade. Difference between European QE and US and UK style QE The European QE announced by ECB last week consists of a monthly Euros 60 bn private and public bond buying that will last until at least September 2016. The euro denominated debt purchases will be all along the yield curve between 2 and 30 years maturities and will represent no more than 25% of each issue. The debt purchases will be mutualised, sharing the loss up to 20% and the rest of 80% will stay with the national central banks. Interestingly, the government debt to be acquired by ECB is investment grade only so Greece and Cyprus debt will likely not be considered for this QE round. While both the Fed and the BoE bought back government debt, so in nature the style of the ECB QE is similar, the lack of debt mutualisation across the Euro zone will skew the benefits towards the countries with best fundamentals in 2016 when the QE starts to slow down. In addition, the funding transmission mechanism in the Euro zone does not work quite the same as in the US or in the UK. Lower rates across the euro zone should lower rates for corporates and individuals but we may not see the impact of these rates in the short term and uniformly across the Euro countries. Euro corporates use far less bond debt than the UK Plc or the US corporates. Even though the European bond market has seen significant growth after the 2009 financial crisis, the majority of the corporate debt, especially for the long term maturities and for the small and medium sized companies, is still bank debt which will be slow to adjust to market yields. The positive and perhaps intended long term consequence here is that it may encourage SMEs to increase financing with corporate bonds issuances in the eurobond market, just like it did after 2009 when bank liquidity dried up. So in the medium and longer term – this is some of the SMEs in Spain and Italy and other non-core Euro markets where the bank lending rates are at 4-6% (Reuters). Most of the immediate positive impact however will be on the larger Eurozone corporates from Germany, France, Spain and the Netherlands (that operate mainly within the Eurozone and as such don’t have a negative currency impact on their revenues) and who can improve their average debt rate substantially. Eurozone mortgages are by and large fixed mortgages from 1 to 5 years and longer and refinancing for these mortgages is not straightforward. While the proportion of variable rate mortgages has increased since 2009, the fixed rate mortgages are still predominant in France, Italy, the Netherlands and Germany, so it will take some time for the wealth effect from lower mortgages and refinancing to have an impact on the consumers in these markets. On the other hand, countries like Spain and Ireland, where most mortgages are based on variable rates may benefit most on short term. Investment Implications As yields are going down, institutional and individual investors are likely to chase higher yield assets like equities, high yield bonds and alternative assets like real estate and private equity: Equity markets in the Eurozone are not as developed as in the UK or the US relative to the size of their GDP. As the chart below shows, the ratio of the equity market to GDP in some European countries like Germany at 54% or Italy at 15% is incredibly low when compared to the UK or the US. Countries with the most developed equity markets, like the Netherlands (NYSEARCA: EWN ), Belgium (NYSEARCA: EWK ), France (NYSEARCA: EWQ ) and Spain (NYSEARCA: EWP ) will likely benefit most from a risk on equity trade. (click to enlarge) Source: Gurufocus, ECB, Reuters Low rates will benefit new investment in real estate and we are likely to see real estate prices going even further up especially in countries where equity markets are not very popular and in countries with mostly variable mortgage rates. Despite a strong performance in the past year, German REITs like Deutsche Wohnen ( OTC:DWHHF ) and Deutsche Annington ( OTC:DAIMF ) are still the best positioned to take advantage of a rising real estate market. Some Spanish real estate developers like Immobiliaria Colonial [COL.SM] may also be an interesting though volatile play. (click to enlarge) Source: Bloomberg Lower Euro will likely bring significant positive changes, even though some economists don’t think so as too many of the goods produced by the euro companies are outside of the Eurozone territory. The services sector, especially the travel and leisure sector including companies like TUI AG, is a clear winner from a lower currency. The SMEs and the corporates with competitive manufacturing bases in the Eurozone exporting outside of the area will also benefit. A lower exchange rate for the Euro will further support the exporters, especially the largest two exporters in the Eurozone who are also highly competitive manufacturers: mostly Germany (which according to WTEx, produced about 29% of the European exports in 2013 and has a large SME sector) and to a lesser extent the Netherlands (with about 9-10% of the European exports in 2013 but a smaller SME sector). In Italy only, the estimated boost to GDP from a lower currency is about 0.6% per year ( CSC, Il Sole 24) While the QE benefits will be widely spread and may give a fresh respite to countries like Italy and France, somewhat ironically the largest positive impact will benefit the countries that have fought it mostly. The Dutch and to a lesser extent the Belgian equity markets and real estate sectors in countries like Germany and Spain will likely be the big winners. Disclosure: The author has no positions in any stocks mentioned, but may initiate a long position in EWN over the next 72 hours. The author wrote this article themselves, and it expresses their own opinions. The author is not receiving compensation for it (other than from Seeking Alpha). The author has no business relationship with any company whose stock is mentioned in this article. Editor’s Note: This article discusses one or more securities that do not trade on a major exchange. Please be aware of the risks associated with these stocks. Disclosure: The author has no positions in any stocks mentioned, but may initiate a long position in EWN over the next 72 hours. (More…) The author wrote this article themselves, and it expresses their own opinions. The author is not receiving compensation for it. The author has no business relationship with any company whose stock is mentioned in this article.
Cold Weather Isn’t Enough To Turn UNG Around

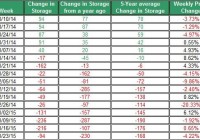
Colder-than-normal weather in parts of the U.S. wasn’t enough to bring back up UNG. This week’s extraction from storage was lower than the 5-year average. EIA still estimates this year’s natural gas demand in the residential and commercial sectors will decline. Next week’s EIA report is expected to show another lower-than-normal extraction from storage. The lower-than-normal extraction from storage and ongoing weakness in the oil market have contributed to the decline of The United States Natural Gas ETF (NYSEARCA: UNG ) to fall below $14 – its lowest price this year. Let’s examine the latest from the natural gas market. The cold weather, mainly in the Northeast, wasn’t enough to keep the price of UNG up as it fell by over 8% during the past week. In the past two months, UNG shed nearly 35% off of its value. This week’s withdrawal from storage was only 94 Bcf – this is below the 5-year average withdrawal, which was 168 Bcf. This comes after two consecutive weeks of above-normal withdrawals from storages. Source of data taken from EIA In next week’s EIA storage update, the extraction from storage could be again lower than the 5-year average – which is 165 Bcf for the last week of January. This is because last week’s deviation from normal temperatures was, on average, 5.93. The correlation between the deviation from normal temperatures and extractions from storage is high at 0.61. Thus, the higher-than-normal temperatures, on a national level, could tilt the scales towards a lower-than-normal withdrawal. Source of data taken from EIA If we were to assume the extraction from storage to remain, on average, 15% higher than the 5-year average, then the storage is likely to be slightly above the 5-year average by the time the extraction season ends in April. Source of data taken from EIA Despite the lower-than-normal extraction from storage, the weather is still expected to be colder than normal throughout the east coast, including in the Northeast over the next two weeks. Conversely, throughout the west coast, temperatures are still projected to remain above normal temperatures. Nonetheless, the uncertainty in the weather is still expected to be high during February, according to latest National Oceanic and Atmospheric Administration monthly report. So we could still see big swings in the price of UNG in the coming weeks. For now, the EIA still predicts that this year’s natural gas consumption in the residential/commercial sectors will decline in 2015. This could be due, in part, to lower demand for heating purposes during this year’s winter. Nonetheless, total consumption is projected to reach 73.8 Bcf per day this year – this is a 0.3% gain compared to the average consumption in 2014. The rise in demand is expected to come from industrial and electric power sectors. In the power sector, coal is being pushed out for natural gas. But it’s still used by major utility companies. Bear in mind, that if coal prices were to keep coming down, as they did in recent weeks, this could also play a secondary role in driving down prices of natural gas. Finally, the weakness in the oil market may have also contributed to the weakness of natural gas. In recent weeks, the linear correlation between oil and natural gas strengthened and reached 0.54 (this is for the past month) – this is a strong and positive correlation albeit this relation doesn’t hold up over extended periods of the time. This is yet another issue to keep in mind. After all, Goldman Sachs lowered its outlook for its U.S. natural gas for this year. This was due to deflationary pressure on prices – the pressure comes from low oil prices that are likely to cut down drilling and services costs, and thus reduce the cost per barrel for shale gas. In other words, Goldman Sachs thinks that drilling companies will drill where it makes fiscal sense to do so considering the current low oil prices; this will also result in lower cost of drilling for natural gas. The recent fall in UNG may have stemmed from the weaker-than-expected demand for natural gas, ongoing strong production and low oil prices. The uncertainty in the weather could still bring back up UNG for a short term. But for now, UNG is still expected to remain low for the season. For more see: A Couple of Notes on Oil