Tag Archives: management

Time To Buy ZIV Again
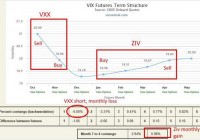
I last recommend ZIV at 39 in October. That trade worked out nicely. ZIV is back at 39 and is again an attractive buy here. I last discussed the VelocityShares Daily Inverse VIX Medium-Term Futures ETF (NASDAQ: ZIV ) in mid-October, calling it a buy to take advantage of excessive market negativity surrounding the potential for an Ebola outbreak in the United States along with uncertainty in the Middle East. ZIV proceeded to rise from 39 to 46 in a straight-line, offering near 20% gains for nimble traders. It’s time to go back to the well as ZIV is again offering a reasonable entry-point. New concerns have shaken the stock market, with pressures from plunging oil prices and earnings misses causing new waves of volatility. Again, like in October, the near-term part of the VIX futures curve finds itself in contango, meaning that it is a bit troublesome to short the iPath S&P 500 VIX ST Futures ETN (NYSEARCA: VXX ) directly. If the VIX futures curve stays where it is currently, VXX will rise gradually just from enjoying the backwardation the market is in. As you can see in the graphic shown later in this article, VXX benefits roughly 2% a month if the futures curve stays as is, which isn’t a huge headwind to the short trade, but it is a deterrent for sure. When you combine that with the cost of borrowing VXX to short, in addition to considering that short VXX has much more risk than long ZIV (since VXX tends to rally far more quickly than ZIV drops), again I’d be preferential to a long ZIV position than a short VXX position here to profit from the excessive volatility priced into the market at the moment. ZIV is an attractive long as the broader market continues to enjoy support around 1990 on the S&P 500 index (NYSEARCA: SPY ). While the market has suffered a few bumps over the past month, economic conditions remain generally favorable and the Fed doesn’t seem inclined to raise interest rates particularly quickly. Fears over Europe have plagued the market since at least 2011 and are unlikely to hold any more merit this time around. Oil prices are a potential hazard, as the energy sector has suffered severe losses, however the benefits of cheaper energy provide sufficient positive feedback to other sectors that the overall impact on the market appears to be contained. Since I last discussed ZIV, the instrument enjoyed a quick 20% rally and then has gradually slid back down to where it traded previously. With this past week’s volatility, ZIV took a nice dive, and now finds itself back at 39, where we dealt with it previously. It’s firmly back in the buy zone, and conditions are equally favorable in comparison to our last entry. I’ve reproduced the chart from our October ZIV buy at 39, with the futures curve today, ZIV also at 39. There’s one positive and one negative, and on the whole it works out to be a wash in my view. (Charts from Vixcentral.com) VIX futures October 17th, 2014: (click to enlarge) VIX futures now (as of 1pm ET Friday): (click to enlarge) On the one hand, ZIV was gaining 1% a month purely from contango. It was buying January futures at 19.36 and selling at 19.93, which produces a 3% gain on each roll. Divide by 3 (since it holds the contracts for 3 months), and you get a percent a month, or more than a 12% compounded annual return if volatility is flat and it just reaps the contango harvest. Now, however, the contango yield has fallen to roughly 0.6% a month, or a bit over 7% annualized, which is a good tailwind to the trade, but not as strong as previously. VIX futures in comparison, October 18th, 2014 versus now: (click to enlarge) However, note that the whole term structure has moved upward. Before ZIV was buying futures at 19.36 and selling at 19.93, now it is buying at 20.05 and selling at 20.45. Thus, ZIV, which is perpetually shorting VIX futures contracts, now has a notably better cost basis for its short positions. This is the beauty of ZIV as a longer-term investment or long-biased trading vehicle: ZIV’s net asset value consistently rises even as the market bounces around; returning to and then deviating again from the mean. What does this mean practically? ZIV is again at 39, where it was in October. However, ZIV’s cost basis for its short positions has now improved by 5%. Should the VIX futures head back to where they were in October, in the low-19s, ZIV would now make a 5% capital gain, moving higher to 41 per share. This before any benefits from contango. While ZIV is priced the same as during the October dip, the VIX curve is higher than before, now offering more potential upside for ZIV on a market normalization to calmer conditions. If VIX settles down in similar fashion to how it did in October, ZIV would reach 48 on this next upswing, taking it almost 25% higher and back to near 52-week highs. Taking a longer-term view of ZIV’s chart, ZIV gradually rises something along the order of 1% a month (what it earns on average from contango) while it swings upward and downward around the trend-line as the market fluctuates. ZIV’s next sustained push higher should take it above 50, as it is overdue for a new high when the market gets over its near-term crisis of confidence. The risk to the trade would be if the market has topped. At some point the bull market will end, and ZIV will no longer be an easy buy on dips. At that point we’ll have to watch the VIX structure closely to see if ZIV stays in contango or not. Should it go into backwardation, like VXX, we’d have to reconsider the viability of the trade. As it is, I don’t think the bull market has ended yet. And alternatively, short VXX will work out better than long ZIV if you are convinced that the market immediately calms down from here. In October, the panic subsided quickly, and shorting VXX did produce a better percentage gain than ZIV. This could happen again if the S&P 500 quickly moves back to its highs. As I’m not convinced this is going to happen, I’d rather take the much more conservative ZIV trade, which offers high probability of 20% near-term upside with limited downside. Disclosure: The author is long ZIV. (More…) The author wrote this article themselves, and it expresses their own opinions. The author is not receiving compensation for it (other than from Seeking Alpha). The author has no business relationship with any company whose stock is mentioned in this article.

Investing In The Russian Market: Oil ETFs Are Better Than Russia-Focused ETFs

The Russian Central Bank surprisingly cuts the key rate to 15%. The implementation of the anti-crisis plan meets first obstacles. ETFs that focus on Russia are unlikely to rise at the same pace as oil ETFs in case of an oil price upside. Russian market has recently been under serious pressure due to sanctions, falling oil prices, devaluation of the ruble and weakening economy. A number of investors believe that the Russian market is cheap right now and await an oil price upside, hoping that it will provide significant upside to ETFs that focus on Russia, like the Market Vectors Russia ETF (NYSEARCA: RSX ), iShares MSCI Russia Capped ETF (NYSEARCA: ERUS ) and SPDR S&P Russia ETF (NYSEARCA: RBL ). However, I would like to argue that investors will be better off investing in oil ETFs, like The United States Oil ETF (NYSEARCA: USO ) or The United States Brent Oil ETF (NYSEARCA: BNO ), if they believe in a bright future for oil prices. Currently, energy accounts for 43.04% of RSX holdings , 49.63% of RBL holdings and 51.97% of ERUS holdings . This means that approximately one half of holdings of these ETFs is not directly related to oil prices. One could argue that oil prices are the single-most important factor for the Russian economy. When oil prices rise, the economy and all its sectors feel better. While this is partly true, I think that there are negative factors that will pressure RSX, ERUS and RBL. The first factor is the continuing devaluation of the ruble. In my view, rising oil prices will not provide a corresponding upside for the currency. This point was recently highlighted by the surprise cut of the key interest rate by the Russian Central Bank on January 30. While Brent oil prices have enjoyed a significant upside since then, the ruble remained roughly unchanged. When the Central Bank was raising its key rate to 17% in December, it stated that these measures were necessary because of ruble depreciation risks and inflation risks. While commenting on the reduction of the key rate from 17% to 15%, the Central Bank stated that it saw a stabilization of inflation and depreciation expectations. In my view, this is a rather strange conclusion. The Central Bank stated that annual consumer price growth rate was 13.1% as of January 26. In comparison, 2014 inflation totaled 11.4%. These numbers show that inflation is increasing rather than stabilizing. The Russian ruble started this year at 59.18 to the dollar. It is trading at 68.92 to the dollar as I’m writing this article. In my view, a 16% devaluation of the ruble cannot be called a “stabilization of depreciation expectations”. Meanwhile, a 15% key rate is still prohibitive for most businesses, and the recent interest rate cut might signal a shift in the Central Bank’s policy. Further rate cuts will lead to more downside for the ruble, pushing RSX, ERUS and RBL lower. The second thing that I’d like to mention is the government’s anti-crisis plan . While the government is sure that it has enough reserves to ensure the implementation of this plan, the process is not going smoothly. The Russian Ministry of Finance stated (please note that the link is in Russian) ( Google translate link ) that it would not be able to allocate enough funds for several anti-crisis measures. While the Ministry of Economic Development proposed to spend 40 billion rubles ($580 million) on credits for Russian regions in the first quarter of 2015, the Ministry of Economic Development is ready to allocate just 10 billion rubles ($145 million) for these measures. In my view, it will take time before the Russian government is able to develop a unified position on the implementation of the anti-crisis plan. Meanwhile, the economy is suffering, and Morgan Stanley is predicting that Russia’s GDP will drop by 5.6% in 2015. In my view, the lack of coordination within the government supports my previous thesis that the situation in the Russian economy will get worse before it gets better. I believe that the fate of the Russian economy remains in the hands of oil prices. I remain skeptical on the current anti-crisis measures. What’s more, I think that ETFs that focus on Russia won’t be able to outperform oil ETFs in the near term. I think that further depreciation of the ruble and problems with the implementation of the anti-crisis plan will hit the non-energy part of RSX, ERUS and RBL portfolios. In my opinion, if an investor is bullish on oil, they should buy oil ETFs rather than ETFs that focus on Russia. Disclosure: The author has no positions in any stocks mentioned, and no plans to initiate any positions within the next 72 hours. (More…) The author wrote this article themselves, and it expresses their own opinions. The author is not receiving compensation for it (other than from Seeking Alpha). The author has no business relationship with any company whose stock is mentioned in this article.

ETFReplay.com Portfolio Update

The ETFReplay.com Portfolio holdings have been updated for February 2015. I previously detailed here and here how an investor can use ETFReplay.com to screen for best performing ETFs based on momentum and volatility. The portfolio begins with a static basket of 14 ETFs. These 14 ETFs are ranked by 6 month total returns (weighted 40%), 3 month total returns (weighted 30%), and 3 month price volatility (weighted 30%). The top 4 are purchased at the beginning of each month. When a holding drops out of the top 5 ETFs it will be sold and replaced with the next highest ranked ETF. The 14 ETFs are listed below: Symbol Name RWX SPDR DJ International Real Estate PCY PowerShares Emerging Mkts Bond WIP SPDR Int’l Govt Infl-Protect Bond EFA iShares MSCI EAFE HYG iShares iBoxx High-Yield Corp Bond EEM iShares MSCI Emerging Markets LQD iShares iBoxx Invest Grade Bond VNQ Vanguard MSCI U.S. REIT TIP iShares Barclays TIPS VTI Vanguard MSCI Total U.S. Stock Market DBC PowerShares DB Commodity Index GLD SPDR Gold Shares TLT iShares Barclays Long-Term Trsry SHY iShares Barclays 1-3 Year Treasry Bnd Fd In addition, ETFs must be ranked above the cash-like ETF SHY in order to be included in the portfolio, similar to the absolute momentum strategy I profiled here . This modification could help reduce drawdowns during periods of high volatility and/or negative market conditions (see 2008-2009), but it could also reduce total returns by allocating to cash in lieu of an asset class. The top 5 ranked ETFs based on the 6/3/3 system as of 1/31/15 are below: 6mo/3mo/3mo LQD iShares iBoxx Invest Grade Bond VNQ Vanguard MSCI U.S. REIT TLT iShares Barclays Long-Term Trsry TIP iShares Barclays TIPS SHY Barclays Low Duration Treasury Since all of the current holdings are still ranked in the top 5 there is no turnover this month. In 2014 I introduced a pure momentum system, which ranks the same basket of 14 ETFs based solely on 6 month price momentum. There is no cash filter in the pure momentum system, volatility ranking, or requirement to limit turnover – the top 4 ETFs based on price momentum will be purchased each month. The portfolio and rankings will be posted on the same spreadsheet as the 6/3/3 strategy. The top 4 six month momentum ETFs are below: 6 month Momentum TLT iShares Barclays Long-Term Trsry VNQ Vanguard MSCI U.S. REIT LQD iShares iBoxx Invest Grade Bond VTI Vanguard Total U.S. Stock Market The top 4 ETFs are the same as last months, so there is no turnover for February. Disclosures: None How did this change your view of ? More Bullish More Bearish It Didn’t This impact ( ) More Bullish More Bearish Unchanged Thanks for sharing your thoughts. Submit & View Results Skip to results » Share this article with a colleague