Tag Archives: management

Investing For Retirement Using American Century Mutual Funds
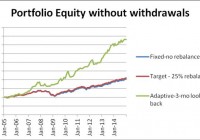
Summary American Century offers a set of diversified mutual funds which can be successfully used for construction of investment portfolios with good withdrawal rates. A set of just three mutual funds, a bond, an equity growth, plus an equity value fund generates good returns with relatively low risk. From January 2005 to December 2014, an American Century portfolio with fixed allocation could produce a safe 5% annual withdrawal rate and 2.15% annual increase of the capital. Same portfolio with rebalancing at 25% deviation from the target allowed a safe 5% annual withdrawal rate and achieved 2.21% compound annual increase of the capital. Same portfolio with momentum-based adaptive allocation could have produced a safe 12% annual withdrawal rate and 3.51% annual increase of the capital. This article belongs to a series of articles dedicated for investing in various mutual fund families. In previous articles we reported our research on Fidelity , Vanguard , and T Rowe Price mutual fund families. The current article does the same for American Century family of mutual funds. The series of these articles is aimed at a broad spectrum of investors. They may be useful to small individual investors as well as to any large institution managing retirement accounts. We report the performance of the portfolios under two scenarios: (1) no withdrawals are made during the time interval of the study, and (2) withdrawals at a fixed rate of the initial investment are made periodically. Since this is the fourth family of mutual funds for which we are building an investment portfolio for retirement, we elaborate here upon the general methodology we use. The set of funds selected for building the portfolio should satisfy the following criteria: (1) It should include at least one bond fund. (2) It should include a few equity funds, generally between two to five. Those funds should have enough similarity and diversity. As an example, we may select one value and one growth fund. (3) Historically, the funds selected should have performed better than most other funds in their category. Applying these principles, we selected three mutual funds for inclusion in a portfolio of American Century mutual funds. They are the following: American Century Government bond fund (MUTF: CPTNX ) American Century Heritage fund (MUTF: TWHIX ) American Century Value fund (MUTF: TWVLX ) As in the previous articles, three different strategies are considered: (1) Fixed asset allocation. The portfolio is initially invested 50% in the bond fund and 50% equally divided between the two stock funds, without rebalancing. (2) Target asset allocation with rebalancing. The portfolio is initially invested 50% in the bond fund and 50% equally divided between the two stock funds and is rebalanced when the allocation to any fund deviates by 25% from its target. (3) Momentum-based adaptive asset allocation. The portfolio is at all times invested 100% in only one fund. The switching, if necessary, is done monthly at closing of the last trading day of the month. All money is invested in the fund with the highest return over the previous 3 months. The data for the study were downloaded from Yahoo Finance on the Historical Prices menu for three tickers: CPTNX, TWHIX, and TWVLX. We use the monthly price data from January 2005 to December 2014, adjusted for dividend payments. The paper is made up of two parts. In part I, we examine the performance of portfolios without any income withdrawal. In part II, we examine the performance of portfolios when income is extracted periodically from the accounts. Part I: Portfolios without withdrawals In table 1 we show the results of the portfolios managed for 10 years, from January 2005 to December 2014. Table 1. Portfolios without withdrawals 2005 – 2014. Strategy Total increase% CAGR% Number trades MaxDD% Fixed-no rebalance 103.55 7.30 0 -24.61 Target-25% rebalance 109.82 7.63 4 -22.03 Momentum-Adaptive 330.90 15.73 35 -13.97 The time evolution of the equity in the portfolios is shown in Figure 1. (click to enlarge) Figure 1. Equities of portfolios without withdrawals. Source: This chart is based on EXCEL calculations using the adjusted monthly closing share prices of securities. From figure 1 it is apparent that the rate of increase of the adaptive portfolio is substantially greater than the rate of the fixed and target allocation portfolios. Part II: Portfolios with withdrawals Assume that we invest $1,000,000 for income in retirement. We plan to withdraw monthly a fixed percentage of the initial investment. That amount is increased by 2% annually in order to account for inflation. In table 2 we show the results of the portfolios managed for 10 years, from January 2005 to December 2014. Money was withdrawn monthly at a 5% annual rate of the initial investment plus a 2% inflation adjustment. Over the 10 years from January 2005 to December 2014, a total of $535,920 was withdrawn. Table 2. Portfolios with 5% annual withdrawal rate 2005 – 2014. Strategy Total increase% CAGR% Number trades MaxDD% Fixed-no rebalance 24.03 2.15 0 -28.78 Target-25% rebalance 22.68 2.21 4 -27.04 Momentum-Adaptive 210.05 11.98 35 -16.41 The time evolution of the equity in the portfolios is shown in Figure 2. (click to enlarge) Figure 2. Equities of portfolios with 5% annual withdrawal rates. Source: This chart is based on EXCEL calculations using the adjusted monthly closing share prices of securities. To illustrate the effect of the withdrawal rates on the evolution of the capital we report simulation results for two strategies: fixed target with rebalancing and momentum-based adaptive asset allocation. In Table 3 we report the results of simulations of the fixed target portfolio with the following withdrawal rates: 0%, 5%, 6%, 8%, and 10%. The time evolution of the equity in the portfolios is shown in Figure 3. To illustrate the advantage of the adaptive allocation strategy and the effect of withdrawal rates on the evolution of the capital, we give in Table 3 the results of simulations for the following withdrawal rates: 0%, 5%, 10%, and 12%. Table 3. Adaptive Portfolios with various annual withdrawal rates 2005 – 2014. Withdrawal rate % Total increase% CAGR% MaxDD% 0 330.90 15.73 -13.97 5 210.05 11.98 -16.41 10 89.54 6.60 -20.24 12 41.20 3.51 -22.23 The time evolution of the equity in the portfolios is shown in Figure 3. (click to enlarge) Figure 3. Equities of momentum-based portfolios with various annual withdrawal rates. Source: This chart is based on EXCEL calculations using the adjusted monthly closing share prices of securities. Conclusion The set of three American Century mutual funds, selected for this study, perform well for all three strategies and generate sustainable returns at relatively low drawdowns. Between 2005 and 2015, the fixed target allocation with rebalancing was able to sustain withdrawal rates of up to 6% annually. The adaptive allocation algorithm was able to sustain withdrawal rates up to 13% annually without any decrease of capital. We must admit here that the performance of the portfolio selected in this article is by no means the best possible. Without doubt, there may be other selections that would have performed better. On the other hand, past performance does not guarantee future results. Finding the best portfolio even for a specified past time interval is a great undertaking. All we can do is to strive toward finding one of the best, not really the best. Same philosophy applies into selecting the family of funds. In an article at the end of the series we will present a comparative study of their relative performance. Disclosure: The author has no positions in any stocks mentioned, and no plans to initiate any positions within the next 72 hours. (More…) The author wrote this article themselves, and it expresses their own opinions. The author is not receiving compensation for it (other than from Seeking Alpha). The author has no business relationship with any company whose stock is mentioned in this article. Additional disclosure: This article is the fourth in a sequence on investing in mutual funds for retirement accounts. To help the reader compare the past performance of various mutual fund families, I selected a benchmark 10-year time interval starting on 1 January 2005 and ending on 31 December 2014. The article was written for educational purposes and should not be considered as specific investment advice.
Selling Stocks Is Like Football: Ohio State Coach Woody Hayes On Portfolio Management

We thinking selling stocks is like football: “There are three things that can happen when you pass the football and two of them are bad.” Investing in common stock has been very rewarding over the decades because it has been a positive sum game. Do you want to throw away one of your best long-term performers the way the Seahawks threw away the Super Bowl? “There are three things that can happen when you pass the football and two of them are bad,” observed The Ohio State University’s legendary coach Woody Hayes. All the Seahawk fans, myself included, know exactly what he is talking about since the Seahawks chose to pass the ball at the one-yard line. You can complete a pass, you can throw it for an incompletion, or you can throw it to the other team (an interception). The same thing can be said for existing common stocks in your equity portfolio. If you sell them, three things can happen and two of them are bad. First, you can sell the shares of common stock and see them greatly underperform the rest of your equity investments (NASDAQ: GOOD ). Second, you can sell the shares and see them outperform your portfolio (bad). The third thing that can happen is comprised of the first two; the expense of trading and the potential of capital gains tax are at best a necessary evil (bad). We believe as a long-duration investor, you need to understand the mathematics of common stocks. When you buy a stock and pay cash, your downside is limited to the amount invested minus the dividends collected prior to bankruptcy. On the other hand, successful common stock holdings can go up by many times what you paid for them. The Bible says that love covers a multitude of sins, and, in portfolio management, your best-performing multiple-decade winners cover a multitude of underperformance by the inevitable common stock duds. Investing in common stock has been very rewarding over the decades because it has been a positive sum game. Nobody has to lose for you to win. We at Smead Capital Management have argued that activity and its insidious cost is the enemy of the active management industry. Warren Buffett says, “Excitement and expense are the enemy of your portfolio.” A Financial Analysts Journal article from February 2013 showed that in the large-cap space, active managers averaged 62% turnover and incurred around 0.80% of annual expense. This rivals annual mutual fund expense as a cost. Every time you sell and buy a new security, you get one of the two bad outcomes, trading expense! Since we have entered a corrective period in the U.S. stock market the last five weeks, it is extremely tempting for active managers to try and guess where the winds will blow in the next three-to-six-months. Doing this would be risking the possibility of two bad outcomes. One of the stocks you were going to do the best on the over next ten years could get thrown out in an effort to maintain your comfort or the comfort of your investors. Do you want to throw away one of your best long-term performers the way the Seahawks threw away the Super Bowl? There are numerous examples in our portfolio where more active managers might trade out. Amgen (NASDAQ: AMGN ) has been a spectacular performer since the summer of 2011, rising from $52 per share to $150 as February 2, 2015. However, the biotech industry has been a very popular group and is likely overdue to disappoint investors. Racier and more exciting small biotech shares soared even more and are correcting more aggressively. Amgen reported excellent results in the fourth quarter of 2014 and raised the dividend 30% for 2015. They guided 2015 earnings estimates from $9.05 to $9.40 per share. At today’s price, this splendid company trades for 16 to 16.5 times this year’s earnings and pays a fast-growing $3.16 dividend. Based on our eight criteria for stock selection, this is a clearly superior company trading at a market multiple. There is a better than average chance that a sale would ultimately include two negatives. Home Depot (NYSE: HD ) has been a great performing stock the last six years. It trades for 20-times this fiscal year’s earnings estimate of $5.20 which ends February of 2016. The company raised the dividend from $1.16 in 2013 to $1.56 in fiscal 2014. It is our expectation that above-average dividend growth will continue for a number of years. The U.S. has been in a housing depression for the last seven years and household spending on home improvement is very low compared to the past thirty years. Residential fixed investment is as low today as a percentage of GDP as it was in the worst recession years of the 1960’s, 1970’s and 1980’s. Lastly, do you want to sell this stock before most Millennials, our largest population group, have bought their first house? Two bad things could happen! We are going to stick with Woody Hayes and give the ball to a couple of meritorious businesses which have created great wealth in the past and not run the risk of making two mistakes. We are willing to explain ourselves later at the podium if one out of the three possibilities (a temporary price drop) makes us look foolish in the short run. Disclaimer: The information contained in this missive represents SCM’s opinions, and should not be construed as personalized or individualized investment advice. Past performance is no guarantee of future results. Bill Smead, CIO and CEO, wrote this article. It should not be assumed that investing in any securities mentioned above will or will not be profitable. A list of all recommendations made by Smead Capital Management within the past twelve month period is available upon request. Disclosure: The author is long AMGN, HD. (More…) The author wrote this article themselves, and it expresses their own opinions. The author is not receiving compensation for it. The author has no business relationship with any company whose stock is mentioned in this article.

Water Utilities: American Water Works, Aqua America Are The Best Fundamental Selections

American Water Works and Aqua America rank highest on the average positioning of five fundamental criteria. American States Water is not far behind. A few water utility stocks have rewarded investors with total returns in excess of the S&P. There are a plethora of firms that play in the water sector from an infrastructure viewpoint. Regulated water utilities have been a sub-sector that attracts investors looking for the stable income attributes of a utility with exposure to both small-caps and a consolidation trend. Some utilities are pure water-focused and some firms have a diversified asset approach where water is a portion of their business portfolio. In addition, there are other industries that are water-related, such as desalination and water treatment along with pumps, pipes, and meters. A good recap of the investment thesis is provided by S Network, developer of the S Network Water Technology Index and S Network Water Works Index. These indexes were previously branded as Janney Indexes. Hundreds of articles have been published on the investment opportunities in the water sector. The underlying thesis is the same: water is one of the most crucial inputs to the global economy, not only supporting residential populations with safe, reliable drinking water, but as a necessary “feedstock” for industrial processes, including electrical power generation, semiconductor manufacturing, pharmaceutical production, and food and beverage processing. Water is also vital to agricultural production, and increasingly rainwater and groundwater supplies are not meeting local agricultural needs in many places around the globe. Within the US, there are regional water issues and many of these cross state regulatory boundaries. For example, according to a report published by calvert.com: ● California – According to the University of California, Davis, climate models show California’s water supply could fall up to 30% over the course of this century. The state’s plan to reduce per capita urban water usage 20% by 2020 is one of many efforts to address this. ● Great Lakes Region – Concerned about proposals to divert its water to other areas, an eight-state agreement now bans water exports from the Great Lakes-home to 90% of the nation’s freshwater and drinking water for 30 million people. ● Northeast – Aging infrastructure causes as much as 50% of clean water here to leak into the ground between treatment centers and the tap. ● The South – Drought has crippled the region in recent years, particularly Texas, where a record-level drought has decimated farms and ranches and caused billions of dollars in damage to the state’s economy. ● Gulf Coast – States such as Florida, Louisiana, and Texas need improvements in storm water management infrastructure due to increased risks from stronger hurricanes. Ten of the more popular stocks for many investors are the following firms, in order of market capitalization: American Water Works (NYSE: AWK ); Aqua America (NYSE: WTR ); American States Water (NYSE: AWR ); California Water (NYSE: CWT ); SJW Corp (NYSE: SJW ); Connecticut Water Service (NASDAQ: CTWS ); Middlesex Water (NASDAQ: MSEX ); York Water (NASDAQ: YORW ); Artesian A (NASDAQ: ARTNA ); Consolidated Water (NASDAQ: CWCO ) As Roberto Clemente once said, “Water stocks have been very, very good to me.” Below are 12-month charts of eight water companies as offered on finviz.com. (click to enlarge) (click to enlarge) (click to enlarge) However, not all water investments have been barnburners over the recent past. Below is a table of average annual 3-year and 5-year total returns, which includes share price appreciation plus dividend income, sorted by highest to lowest 5-yr return (S&P 500 average annual total returns are 17.8% and 16.5%, respectively): Source: Morningstar There is quite a difference between the best and the worst performers. However, this is yesterday’s news and investors should be looking towards tomorrow’s news. One management attribute worth analyzing is their ability to generate return on invested capital ROIC. The advantage of ROIC is it evaluates returns across the capital structure and is not limited to just equity or assets. One would think the highest returns would correlate with the highest share price appreciation, but it does not. Below is the same ten companies’ average ROIC for the previous 3-years and their respective 5-yr total stock returns: Source: Fastgraph, Morningstar, My Investment Navigator Overall, the regulated utility sector has an average ROIC in the 5% range, and most of these companies meet or exceed this level. Nevertheless, ROIC is only half the equation as it only evaluates the return of capital deployed and not the cost of capital. The best companies generate ROIC in excess of their weighted average cost of capital or WACC. Below is the Net ROIC, or ROIC less WACC, for these ten companies: Source: My Investment Navigator, Morningstar, ThatsWACC.com It seems only two management teams have generated returns on their total capital structure in excess of the cost of the same capital. It is intriguing the stocks with the best 5-yr total stock returns are not those generating the highest investor returns based on capital deployed and the cost of that capital. Dividend growth investors would be please by the majority of water utilities, and most have outpaced the meager inflation numbers of the past three years. In 2012, inflation as measured by the monthly CPI averaged 2.1%, in 2013 it was 1.5% and last year 1.6%, for a 3-yr average of 1.7%. Source: Reuters S&P offers an Equity Quality Ranking system evaluating a company’s 10-yr history of consistently generating earnings and dividend growth. The rankings range from A+ as the Highest, B+ as Average and NR as Not Rated. The Quality Ranking for these 10 companies are: A+: None; A: AWR, WTR, YORW; A-: CWT, MSEX, ARTNA. CWTS is ranked B+, SJW as B, and AWK, CWCO as Not Rated. Some investors prefer the diversity and ease of water ETFs: PowerShares Water Resources (NYSEARCA: PHO ), Guggenheim S&P Global Water Index (NYSEARCA: CGW ), PowerShares Global Water Resources (NYSEARCA: PIO ), and First Trust ISE Water Index (NYSEARCA: FIW ) Fund. In addition to these popular water utility firms and ETFs, several others play in the water sector. Of interest is the list offered by S Network Water Technology Index found here . These are global companies in the infrastructure, pump, and metering business with exposure to the water industry. Scanning these names may provide further opportunities worth researching. S Network also offers a variety of water information resources linked to its site here . I prefer to pick specific stocks over ETFs, unless there is disruptive technology involved that can upset the apple cart, and I do not see this happening in the water sector. As one who believes in ROIC, if I had to chose one water utility, it would be either American Water Works or Aqua America. Below is that ranking of each company in the tables above. AWK and WTR ranked the highest on average of these five criteria. American States Water is very close as well and should not be forgotten. Ranking By Order For Each Category Source: My Investment Navigator I have been writing about water stocks since 1997 and the trends in water investing are called out in my two books. This is one area every investor should have in their utility portfolio. Author’s Note: Please review disclosure in Author’s profile. Disclosure: The author is long WTR, AWK. (More…) The author wrote this article themselves, and it expresses their own opinions. The author is not receiving compensation for it (other than from Seeking Alpha). The author has no business relationship with any company whose stock is mentioned in this article.