Tag Archives: management

SPY And U.S. Economic Index Move In Sync For Third Straight Month
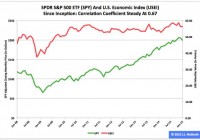
Summary The SPDR S&P 500 ETF and my U.S. Economic Index in January reversed their roles of a month earlier, as the former dropped and the latter dipped. The exchange-traded fund and my economic indicator moved in the same direction in each of the past three months. The correlation coefficient between them over the lifetime of their relationship held steady at 0.67. The SPDR S&P 500 Trust ETF (NYSEARCA: SPY ) and my U.S. Economic Index both headed south in January for the second straight month, but, as was the case in December, the magnitudes of their moves were quite different. SPY’s (quarterly) adjusted closing monthly share price slid to $199.45 from $205.54, a decline of -$6.09, or -2.96 percent, while the USEI’s (annually) adjusted level slipped to 56.31 from 56.33, a decline of -0.02 points, or -0.03 percent. Combining Institute for Supply Management manufacturing and nonmanufacturing figures with a special sauce, I assembled the USEI in an effort to capture all American economic activity in a single monthly number I can employ in guiding my investing and trading, as I mentioned when introducing the metric at J.J.’s Risky Business . Readers with an interest in my articles about the SPY-USEI relationship published during the past year are probably aware the SPY data series I employ historically has been adjusted quarterly. However, they are possibly unaware the three underlying USEI data series I use to calculate the index reading historically have been adjusted annually. Thanks to our ISM droogies bringing up-to-date their manufacturing and nonmanufacturing statistics this week, I was able to slather them with my special sauce, so the USEI’s annual adjustment in 2015 is complete. The most noticeable effect of this adjustment centers on the index’s value at its all-time high. Before the adjustment, the USEI peak was the 59.53 calculated for August 2014, followed by the 59.23 calculated for November 2014. After the adjustment, the index peak is the 58.65 calculated for last November, followed by the 58.54 calculated for last August. All the below data reflect the annual adjustment. Figure 1: SPY, USEI Monthly Values, January 2008-January 2015 (click to enlarge) Note: The SPY adjusted closing monthly share-price scale is on the left, and the USEI monthly value scale is on the right. Source: This J.J.’s Risky Business chart is based on proprietary analyses of ISM data and Yahoo Finance adjusted closing monthly share prices. ISM published its latest manufacturing data Monday and its latest nonmanufacturing data Wednesday. It has reported the relevant figures in the former series since January 1948, but the relevant numbers in the latter series since just January 2008. Thus, the complete data set for the USEI covers only 85 months (Figure 1). I calculate the SPY-USEI correlation coefficient as 0.67 during this period, the same as in each of previous two months. The comparable statistics were 0.66 for October, 0.65 for September, 0.64 for August, 0.63 for July and 0.61 for each of the four months between March and June. Therefore, the coefficient rose five months in a row until December. Figure 2: SPY-USEI Correlations, January 2009-January 2015 (click to enlarge) Note: My baseline conceptually consists of the first 12 SPY-USEI correlation coefficients, which are excluded here. Source: This J.J.’s Risky Business chart is based on proprietary analyses of ISM data and Yahoo Finance adjusted closing monthly share prices. For the USEI’s first 57 months (i.e., before the dawn of the U.S. Federal Reserve’s most recent quantitative-easing program, aka the Age of QE3+ ), I calculate the SPY-USEI correlation coefficient as 0.75. I interpret this number as evidence of a positive correlation between the equity market and the economy that was both stable and strong. For the index’s last 28 months (i.e., after the dawn of the Fed’s Age of QE3+), I calculate the SPY-USEI correlation coefficient as 0.57. I interpret this number as evidence of a breakdown in their relationship, indicating a disruption in the continuous feedback loop between the stock market and the economy. However, this disruption’s effects have been fading since the Fed began to significantly taper QE3+, as documented by the SPY-USEI correlation coefficient’s movement during the past seven months (Figure 2). This lengthy trend suggests substantial progress in the normalization of the relationship between the market and the economy. Figure 3: USEI Monthly Mean And Median Values, 2010-2014 (click to enlarge) Note: The current expansion began in June 2009, according to the Business Cycle Dating Committee of the National Bureau of Economic Research . Source: This J.J.’s Risky Business chart is based on proprietary analyses of ISM data. Neither the first quarter in general nor February in particular historically has been a great time for SPY, as documented elsewhere . Consistent with the ETF’s behavior and the interlocking nature of the SPY-USEI relationship, analysis of the seasonality of the USEI likewise indicates the same two periods have been among the weakest time frames of the annual cycles during the initial five full years of the current economic expansion from 2010 to 2014 (Figure 3). Figure 4: USEI Monthly Values, 2015 Versus 2010-2014 Mean (click to enlarge) Source: This J.J.’s Risky Business chart is based on proprietary analyses of ISM data. The USEI was an overachiever to a significant degree in January when compared with the relevant mean value compiled for the same month during the initial five full years of the current expansion (Figure 4). From January to February in this period, the index fell thrice and rose twice, once by a little (0.02 percent) and once by a lot (1.75 percent). Figure 5: USEI Monthly Values, 2015 Versus 2010-2014 Median (click to enlarge) Source: This J.J.’s Risky Business chart is based on proprietary analyses of ISM data. The USEI also was an overachiever to a significant degree in January when compared with the relevant median value compiled for the same month during the initial five full years of the current expansion (Figure 5). Statistically, the preponderance of the evidence suggests it is probable the index will be lower in February than it was in January. Figure 6: USEI Monthly Values With 3-Month And 12-Month SMAs (click to enlarge) Source: This J.J.’s Risky Business chart is based on proprietary analyses of ISM data. The conditions underlying the USEI’s current status should do nothing to create a roadblock for a Federal Open Market Committee on its way to announce its first interest-rate increase in eight-plus years as soon as April 29, six months after the Federal Reserve concluded asset purchases under QE3+ (Figure 6). And I suspect such an event would be a big deal, not only for the economy, as represented by the USEI, but also for the large-capitalization segment of the market, as represented by SPY. Disclaimer: The opinions expressed herein by the author do not constitute an investment recommendation, and they are unsuitable for employment in the making of investment decisions. The opinions expressed herein address only certain aspects of potential investment in any securities and cannot substitute for comprehensive investment analysis. The opinions expressed herein are based on an incomplete set of information, illustrative in nature, and limited in scope. In addition, the opinions expressed herein reflect the author’s best judgment as of the date of publication, and they are subject to change without notice. Disclosure: The author has no positions in any stocks mentioned, and no plans to initiate any positions within the next 72 hours. (More…) The author wrote this article themselves, and it expresses their own opinions. The author is not receiving compensation for it (other than from Seeking Alpha). The author has no business relationship with any company whose stock is mentioned in this article.

4 Ways Alternatives Can Prepare Portfolios For The Future

Summary Many advisors and their clients are now in the process of reviewing last year’s performance and discussing how to best position their portfolios for what’s to come. I believe they should examine how alternative investments could be included in portfolios to potentially help achieve specific investment objectives. This piece lists four ways investors can use alternatives in seeking to meet common objectives. By Walter Davis Many advisors and their clients are now in the process of reviewing last year’s performance and discussing how to best position their portfolios for what’s to come. These reviews are taking place against the backdrop of a multi-year bull market in equities, low interest rates, low levels of market volatility, a strengthening dollar and declining oil prices. As advisors and clients look to navigate this landscape, I believe they should examine how alternative investments could be included in portfolios to potentially help achieve specific investment objectives. To help with this task, I have listed four ways investors can use alternatives in seeking to meet common objectives. Objective: Continue to participate in equity market upside, but with some downside protection. Investors have enjoyed a strong run in equities over the past six years, and most analysts I have read predict 2015 to be another positive year. That said, investors have also seen increased risks come into the market, such as Greece’s future in the eurozone. For investors looking to participate in a rising equity market, while also seeking to limit the downside if the market declines, equity long/short funds may be able to help. Equity long/short funds combine both long and short equity positions in a portfolio, while typically being net long to equities. In these types of funds, the long positions would be expected to capture gains in a rising equity market environment while the short positions would be expected to profit in a falling market environment. Because these funds are frequently net long, the direction of fund performance often tracks that of the overall market. Objective: Participate in market opportunities outside of stocks and bonds, such as in the commodity and currency markets. In 2014, the U.S. dollar appreciated over 10% against its counterparts, and the price of oil fell by almost 50%. Global macro funds invest across the global markets in equities, fixed income, currencies and commodities on a long and short basis. Such funds could have had the opportunity to profit from the rally in the U.S. dollar through long U.S. dollar positions, as well as from the decline in oil through short oil positions. Objective: Cushion portfolio during market swings . One theme I have seen repeatedly mentioned by market analysts is the return of market volatility to normal historic levels. Over the past six months, we have seen short periods of heightened market volatility, most recently during the first two trading weeks of 2015. For investors looking to cushion their portfolio during increased market swings, market neutral funds might be appealing options. Such funds seek to eliminate the impact of broad market movements by trading related stocks on a long and short basis, and seek to generate positive returns regardless of market environment. Objective: Generate attractive levels of income in the current low interest rate environment . With interest rates at historic lows, many investors, especially retirees, are seeking to earn an attractive level of current income off their investments. Two places that investors can explore are real estate income funds and bank loan funds. Real estate income funds invest in global real estate equity and fixed income securities and seek attractive current income. Bank loan funds seek to provide a high level of current income and capital appreciation by investing in senior loans made to corporations (usually rated below investment grade) by large banks and other financial institutions. Important Information Before investing, carefully read the prospectus and/or summary prospectus and carefully consider the investment objectives, risks, charges and expenses. For this and more complete information about the products, visit invesco.com/fundprospectus for a prospectus/summary prospectus. There is no guarantee the strategies discussed will meet their investment objectives. Investors should consider their risk tolerance and individual situation and carefully review all financial information before investing. Alternative products typically hold more non-traditional investments and employ more complex trading strategies, including hedging and leveraging through derivatives, short selling and opportunistic strategies that change with market conditions. Investors considering alternatives should be aware of their unique characteristics and additional risks from the strategies they use. Like all investments, performance will fluctuate. You can lose money. The dollar value of foreign investments will be affected by changes in the exchange rates between the dollar and the currencies in which those investments are traded. Commodities may subject an investor to greater volatility than traditional securities such as stocks and bonds and can fluctuate significantly based on weather, political, tax, and other regulatory and market developments. Investments in real estate related instruments may be affected by economic, legal, or environmental factors that affect property values, rents or occupancies of real estate. Real estate companies, including REITs or similar structures, tend to be small and mid-cap companies and their shares may be more volatile and less liquid. Most senior loans are made to corporations with below investment-grade credit ratings and are subject to significant credit, valuation and liquidity risk. The value of the collateral securing a loan may not be sufficient to cover the amount owed, may be found invalid or may be used to pay other outstanding obligations of the borrower under applicable law. There is also the risk that the collateral may be difficult to liquidate, or that a majority of the collateral may be illiquid. Short sales may cause an investor to repurchase a security at a higher price, causing a loss. As there is no limit on how much the price of the security can increase, exposure to potential loss is unlimited. The information provided is for educational purposes only and does not constitute a recommendation of the suitability of any investment strategy for a particular investor. Invesco does not provide tax advice. The tax information contained herein is general and is not exhaustive by nature. Federal and state tax laws are complex and constantly changing. Investors should always consult their own legal or tax professional for information concerning their individual situation. The opinions expressed are those of the authors, are based on current market conditions and are subject to change without notice. These opinions may differ from those of other Invesco investment professionals. NOT FDIC INSURED MAY LOSE VALUE NO BANK GUARANTEE All data provided by Invesco unless otherwise noted. Invesco Distributors, Inc. is the U.S. distributor for Invesco Ltd.’s retail products and collective trust funds. Invesco Advisers, Inc. and other affiliated investment advisers mentioned provide investment advisory services and do not sell securities. Invesco Unit Investment Trusts are distributed by the sponsor, Invesco Capital Markets, Inc., and broker-dealers including Invesco Distributors, Inc. PowerShares® is a registered trademark of Invesco PowerShares Capital Management LLC (Invesco PowerShares). Each entity is an indirect, wholly owned subsidiary of Invesco Ltd. ©2014 Invesco Ltd. All rights reserved. blog.invesco.us.com

Star Gas Partners: A Deeply Undervalued Beneficiary Of Low Oil Prices Offering 40% To 90% Upside

Summary Star Gas Partners is the largest distributor of home heating oil in the United States, serving residential and commercial customers in fourteen states throughout the Northeastern U.S. and Mid‐Atlantic. At the current valuation the Company is selling at an 18% cash flow yield based on our expectations for $68 million in distributable cash flow in 2015. When valuing SGU at close to a 30% discount to its peer EV/ EBITDA multiples the stock is worth over 90% more than the current share price. Star Gas Partners (NYSE: SGU ) is the largest distributor of home heating oil in the United States, serving residential and commercial customers in fourteen states throughout the Northeastern U.S. and Mid‐Atlantic. The Company has a market value of just $375 million, yet in 2014 generated $1.96 billion in revenues and $103 million in EBITDA. SGU’s revenues are highly recurring, with 97% of customers on automatic delivery schedules. The market for home heating oil is mature but extremely fragmented; Although, SGU has a market share that is likely under 5% it is still 200x larger than its average competitor. The heating oil industry also features attractive financial characteristics, with recurring cash flows and contractually determined gross profit per gallon. Star Gas’s gross profit is largely fixed at $1.00/gallon and the Company constantly hedges its exposure. Considering Star Gas has net debt of approx. $75 million (net debt is adjusted after making changes to working capital to reflect receivable collections) the market is drastically undervaluing the Company. At the current share price of $6.55 the Company is selling at an 18% cash flow yield based on our expectations for $68 million in distributable cash flow in 2015. Essentially, if one were to buy the Company outright at the current price they would net an 18% annual cash return before Capex (Capex is running at approx. $10 million per year). The question one might ask is how can such a high return investment be available in the current low return environment we are in? The answer lies in the following non-fundamental issues that have caused investors to bypass making an investment In SGU: SGU has an inefficient corporate structure- Star Gas was formed as an MLP, yet should ideally be structured as a corporation. Star Gas acts as a partnership, which owns Petro Holdings, which acts as the heating oil corporation. Although Petro Holdings is taxed at the corporate level, any cash moved out of the holdings and into the partnership for either dividends or share repurchases may also be taxable to unit holders as dividends. Therefore, shareholders may be obligated to pay a dividend tax without ever receiving a dividend if funds were used to repurchase shares. Although, the current structure is by no means efficient it is not material enough to justify the current discount of the Company’s shares. Low dividend yield- Although Star Gas generates over $60 million in distributable cash flow it pays out less than $20 million in dividends, which implies a 5% yield. MLP peers typically payout over 80% of their cash flow and at higher yields. Highly seasonal business leads earnings to appear volatile- Because Star Gas makes money in the winter season the Company generates all of its earnings during half the year and loses money during the other half. This presents an appearance of inconsistent earnings from quarter to quarter. Declining business due to competition- The main competition for heating oil distributors is customer conversion to natural gas, which is generally significantly cheaper than heating oil. However, for many heating oil users, the local utility has no gas main capable of reaching their homes. For others, however, once their oil burner requires replacement (estimated cost: $2,000‐$3,000) the economics can be compelling. Conversion costs average $10,000, so the incremental costs of converting can be $7,000 to $8,000. Yet, over the past five years, the loss to natural gas conversion has ranged from 1.5%‐2.0% and the Company’s overall net attrition stood at just 0.9% in 2014. All the above issues have existed now for some time, yet Star Gas continues to increase both profits and shareholder value. Since 2010 the Company has increased annual EBITDA by 44% and reduced shares outstanding by 23% from 75 million shares to 57.2 million shares. Thus, on a per share basis the Company has increased EBITDA from $1.02 to $1.79 or by 75% over the last 4 years. The market also fails to realize that Star Gas is a beneficiary of low oil prices. As heating oil prices have gone down Star Gas’s business has received a major tailwind. The company is now able to buy the same quantity of heating oil while using significantly less working capital therefore minimizing borrowing costs and working capital needs. Furthermore, as a result of lower heating bills the Company’s customers are now less likely to switch to natural gas as conversion economics have come down substantially. This tailwind was evident in their most recent Q1 2015 earnings as the company increased EBITDA by 25% to $45 million. Assuming YOY growth remains flat for the remainder of the year, Star Gas should be able to generate $70 million in cash flow and $60 million in Free Cash Flow for 2015. This should allow the company to either significantly increase its dividend or buyback program. To put things in perspective, Star Gas has a distribution coverage ratio of over 3x their current dividend. If their distribution coverage was similar to that of their MLP peers (1.1x to 1.2x) the company would have a current dividend yield of well over 10%. When we compare Star Gas to larger propane and fuel delivery MLPs the investment looks even more compelling. Company Mkt Cap (In millions) P/E Ratio EV/EBITDA P/CF Dvd Yld Average $ 3,163 20.3x 11.17x 9.87x 7.68% SUBURBAN PROPANE PARTNERS LP (NYSE: SPH ) $ 2,721 20.3x 11.1x 9.6x 7.8% FERRELLGAS PARTNERS-LP (NYSE: FGP ) $ 1,937 23.2x 11.8x 10.2x 8.6% AMERIGAS PARTNERS-LP (NYSE: APU ) $ 4,831 17.4x 10.7x 9.8x 6.7% STAR GAS PARTNERS L.P. $375 11.5x 4.8x 6.3x 5.35% As the larger comps clearly have more diversified stable businesses we do not believe Star Gas should trade at a similar multiple. However, we firmly believe the company should trade at a multiple between 6x to 8x EBITDA. Using that range, Star Gas shares would be worth anywhere from $9.15 to $12.50 per share. This implies potential upside of 40% on the low end to over 90% on the high end. Disclosure: The author is long SGU. (More…) The author wrote this article themselves, and it expresses their own opinions. The author is not receiving compensation for it (other than from Seeking Alpha). The author has no business relationship with any company whose stock is mentioned in this article.