Tag Archives: management

3-Year Trailing Returns: Momentum And Mean Reversion In Developed Markets
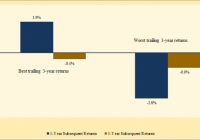
By Baijnath Ramraika, CFA Ben Inker, in GMO’s 4Q 2014 quarterly letter , suggests that there is significant valuation disparity among developed markets with U.S. markets getting a much higher valuation in relation to others. He suggests that given this disparity, it makes more sense to invest in the bad and ugly countries as against the good-looking U.S. In that same letter, Ben shows that it is better to be a contrarian. As evidence, he shows that those developed markets which had the strongest relative performance over the past three years, tend to underperform over the next one- and three-year periods. On the other hand, the worst performing developed markets over the past three years, tend to outperform over the next one- and three-year periods. Wanting to verify, I setup a similar process based on the all-stock developed market indexes that I discussed in one of my earlier articles . The objective was to check the relative investment performance of investing in strongest versus weakest performing developed markets over the past three years. To achieve this, I used country indexes calculated in dollar terms. At the end of every year, I calculated the annualized trailing 3-year return for every country. This return was compared to the average return of all developed market countries to derive relative out(under)performance. Each country was then ranked based on its trailing 3-year relative performance with five best and worst performing countries chosen for further analysis. Figure 1 shows the average 1-year and 3-year subsequent annualized excess returns for the best and worst five countries. It is important to note that the time frame of this study is 1995 to 2014. With three years of past performance as the selection criteria, the study begins at end of the year 1997. Figure 1 (click to enlarge) Trailing 3-year performance as a predictor for forward returns Clearly, my numbers are not in sync with what Ben Inker found in his analysis. There are several possible reasons for this difference. For one, the time period of my study may be different than the time period used by Ben. Secondly, while my study utilizes all stock indices, it is possible that indices used by Ben are somewhat narrower in representation. Keeping the different result aside, what Figure 1 suggests is that there is some momentum persistence, at least in the near term. The best performing five countries continued to outperform over the next year while the worst performing five countries continued to underperform over the next year. However, as is evident by the difference between 1-year and 3-year subsequent annualized returns, there seems to be some mean reversion taking place in year 2 and 3. Figure 2 shows this mean reversion. Figure 2 (click to enlarge) Mean reversion takes hold in the second and third year As is seen, countries with the best 3-year trailing performance experience negative relative performance in the second and the third year, i.e., momentum persists over the one-year period with mean reversion taking over after that. In summary, both momentum and mean reversion have an effect on subsequent investment returns. However, their effects are felt in different time frames.
The U.S. Economy Recovers – GLD Comes Down

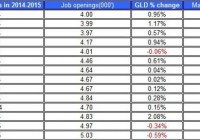
The non-farm payroll brought down GLD. Rising long-term treasury yields are keeping down GLD. It’s still uncertain where the demand for gold in China and India is heading. The recovery of the SPDR Gold Trust (NYSEARCA: GLD ) came to a halt in recent weeks as the recent economic indicators, mainly in the U.S. labor market, were better than anticipated. Let’s review the latest from the U.S. economy and its relation to the progress of GLD. The two major labor reports are the non-farm payroll and JOLTS. The non-farm payroll presented better-than-expected results. The JOLTS report was in line with market expectations. These reports suggest the U.S. economy is progressing with higher number of jobs, more job openings, and improved wages. The recent JOLTS report presented another positive gain in the number of job openings as it passed 5 million. Quit rate hasn’t changed at 1.9%, but the number of quits continues to slowly pick up, which is another positive indication for the progress in the U.S. labor force. In the past, the price of GLD tended to react strongly to the non-farm payroll report and to a lesser degree to the JOLTS report, as presented in the table below. (click to enlarge) Source of data taken from Google Finance and U.S. Bureau of Labor Statistics But the recovery in the labor market is likely to enable the FOMC, down the line, to raise rates. Higher rates in the coming months aren’t likely to do well for the price of GLD. One important issue related to the non-farm payroll report was the gain in wages – which also implies higher core inflation. After all, wages have risen by 2.2% year over year and by 0.5% compared to the previous month. (click to enlarge) Source of chart: FRED Is the current rate of gain in wages good enough for the FOMC? The chart above presents the year-over-year percent changes in U.S. wages over the past few years. The FOMC aims to reach a core inflation target of 2%, which isn’t far off the current gain in wages. Nonetheless, the growth in wages is still well below the levels recorded before the 2008 recession. So even though wages have gone up, they still have a long way to go before reaching their high levels of 2007. The other side of equation related to the labor market is the unemployment rate, which is currently at 5.7%. Back in 2007, the rate of unemployment was around 4.5%, but the FOMC’s long-term rate is around 5.3%. So the current level isn’t far off the FOMC’s long-term target, and thus, shouldn’t be among the factors holding back the FOMC from raising rates, right? (click to enlarge) Source of chart: FRED It depends on who you ask. According to a recent article by Krugman , the natural rate of unemployment is actually below 5%. Even if the rate of unemployment and wages are still off the “healthy levels”, for now, it seems a bit of stretch to consider they will be enough to impede the FOMC from raising rates in the middle of the year. One factor that has changed course in recent weeks is the rise in interest rates: The 10-year U.S. treasury yields have gone up and reached 2%. Source of data taken from U.S. Treasury and Google Finance The relation between the changes in yields and the price of GLD remains mid-strong and robust – it currently stands at -0.365. This negative relation suggests that if U.S. treasury were to keep picking up, this trend could also coincide with the drop in shares of GLD. Despite the recent fall in the price of GLD, the demand for the ETF has picked up – the ETF’s gold holdings continue to rise, as indicated in the chart below. Source of data taken from GLD’s website Keep in mind that the recent developments in Europe, including the ECB’s QE program and the higher chances (the market gives) of a Greek exit from the EU weigh on the euro. The higher uncertainty is likely to do well for the U.S. dollar, which isn’t something good for the price of GLD, but could also raise the demand for gold as an investment. Besides the changes in the demand for gold as an investment, the physical demand for gold is another, albeit secondary, factor to consider for the progress of gold prices. On this front, the leading country in consuming gold is China – the country has taken the reign from India as the leading importer of gold. In 2014, however, China’s gold consumption dropped by 25% compared to 2013. But since the beginning of the year , the demand for gold in China has started to pick up. Bear in mind, however, that China’s economy is expected to grow at a slower pace than in previous years, which may also translate to slower growth in demand for gold. India may also see a rise in gold imports if government officials were to follow through and reduce the import tax on the yellow metal. It’s still unclear where the chips will fall for gold consumption in China and India, but if these countries do surprise and show higher consumption, this could play a secondary role in raising gold prices. The rise in U.S. treasury yields and the improved U.S. labor market don’t vote well for the price of GLD. But there are also other factors to consider that could curb down the descent of gold. The uncertainty around Europe’s future and the demand for gold in China and India are question marks that could play in favor of gold. For more see: Gold and Inflation – Is there a relation? Disclosure: The author has no positions in any stocks mentioned, and no plans to initiate any positions within the next 72 hours. (More…) The author wrote this article themselves, and it expresses their own opinions. The author is not receiving compensation for it (other than from Seeking Alpha). The author has no business relationship with any company whose stock is mentioned in this article.

Dual Momentum Portfolio Update

Scott’s Investments provides a free “Dual ETF Momentum” spreadsheet which was originally created in February 2013. The strategy was inspired by a paper written by Gary Antonacci and available on Optimal Momentum. Antonacci has a new book out, Dual Momentum Investing: An Innovative Strategy for Higher Returns with Lower Risk . If you want to see how he applies Dual Momentum to a portfolio strategy I encourage you to read the book. My Dual ETF Momentum spreadsheet is available here and the objective is to track four pairs of ETFs and provide an “Invested” signal for the ETF in each pair with the highest relative momentum. Invested signals also require positive absolute momentum, hence the term “Dual Momentum.” Relative momentum is gauged by the 12 month total returns of each ETF. The 12 month total returns of each ETF is also compared to a short-term Treasury ETF (a “cash” filter) in the form of iShares Barclays 1-3 Year Treasury Bond ETF (NYSEARCA: SHY ). In order to have an “Invested” signal the ETF with the highest relative strength must also have 12-month total returns greater than the 12-month total returns of SHY. This is the absolute momentum filter which is detailed in depth by Antonacci, and has historically helped increase risk-adjusted returns. An “average” return signal for each ETF is also available on the spreadsheet. The concept is the same as the 12-month relative momentum. However, the “average” return signal uses the average of the past 3, 6, and 12 (“3/6/12″) month total returns for each ETF. The “invested” signal is based on the ETF with the highest relative momentum for the past 3, 6 and 12 months. The ETF with the highest average relative strength must also have an average 3/6/12 total returns greater than the 3/6/12 total returns of the cash ETF. Portfolio123 was used to test a similar strategy using the same portfolios and combined momentum score (“3/6/12″). The test results were posted in the 2013 Year in Review and the January 2015 Update. Below are the four portfolios along with current signals: Return data courtesy of Finviz Equity Representative ETF Signal based on 1 year returns Signal based on average returns U.S. Equities VTI Invested Invested International Equities VEU Cash SHY Credit Risk Representative ETF Signal based on 1 year returns Signal based on average returns High Yield Bond HYG Invested Interm Credit Bond CIU Invested Cash SHY Real-Estate Risk Representative ETF Signal based on 1 year returns Signal based on average returns Equity REIT VNQ Invested Invested Mortgage REIT REM Cash SHY Economic Stress Representative ETF Signal based on 1 year returns Signal based on average returns Gold GLD Long-term Treasuries TLT Invested Invested Cash SHY As an added bonus, the spreadsheet also has four additional sheets using a dual momentum strategy with broker specific commission-free ETFs for TD Ameritrade, Charles Schwab, Fidelity, and Vanguard. It is important to note that each broker may have additional trade restrictions and the terms of their commission-free ETFs could change in the future. Disclosures: None Are you Bullish or Bearish on ? Bullish Bearish Neutral Results for ( ) Thanks for sharing your thoughts. Submit & View Results Skip to results » Share this article with a colleague