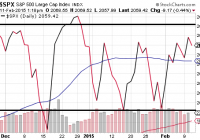
The long-term CAPE average is 16.5. Today’s CAPE is north of 27. CAPE ratios above 27 have only occurred in the months around 1929, 1999 and 2007. I believe that we are closer to the next “common sense” recession than we are to extraordinary acceleration of the U.S economy. The cyclically-adjusted price-to-earnings ratio (a.k.a CAPE, P/E10, Shiller’s P/E) evaluates the average inflation-adjusted earnings for the S&P 500 over the previous 10 years. The long-term CAPE average is 16.5. Today’s CAPE is north of 27. And despite numerous detractors on its predictive value, P/E10 led directly to a Nobel Prize for its creator, Robert Shiller. With 140 years of market data, CAPE ratios above 27 have only occurred in the months around 1929, 1999 and 2007. Equally worthy of note, the Nobel economist’s work accurately identified the bursting of the dot-com bubble (1999-2000) as well as the collapse of the financial system (2007-2008). Unfortunately for those who might like to argue why Shiller’s valuation methodology is irrelevant in 2015, U.S. stock prices are expensive whether you compare them to trailing 12 month earnings, forward 12 month earnings (being revised in light of the energy sector), book value and cash flow. Granted, one can suggest that zero percent rate policy makes Shiller’s P/E impotent; heck, those ridiculously low yields across the curve may make every traditional valuation metric worthless. Still, the more probable set of circumstances is that a bear market in equities is not too far off and that traditional valuation still has at least a single seat at the NYSE. Indeed, if global interest rates continue to decline, strong corporations may do the same thing that they have been doing for the past six years; that is, they may issue low rate investment grade debt and use the funds to repurchase shares of corporate stock. That activity boosts the “E” in company earnings. I still believe this activity will keep equities from dropping off a cliff in the shorter-term. If nothing else, it is largely responsible for keeping the heralded index range-bound for the better part of the last 10 weeks. Looked at another way, why would CEOs commit capital to major projects or human resources right now? The strong dollar is killing exports, weaker foreign currencies are hurting profits, global deflation is hindering sales and volatile oil prices are increasing geopolitical risks. The “go-to” move of share buybacks may very well be the primary driver that keeps the S&P 500 from falling out of bed. We should be cognizant, however, that stock buybacks for the S&P 500 are already approaching the record highs set in mid-2007. Is that a good thing? Or does it merely mask the declining sales and increasing debt of the companies that engage in the practice for too long? On the other side of the coin is the reality that bear markets are inevitable. So I decided to conduct a little exercise. What if the S&P 500 fell an average bear market percentage drop from its 2093 perch? If you split the difference between the average bearish descent since 1926 (35%) and the median plunge since 1871 (38%), the S&P 500 would bottom out near 1330. Let’s take that prospect a step further. The total return for the SPDR S&P 500 Trust ETF (NYSEARCA: SPY ) with dividends reinvested would come in around 17.5% for the first 14-plus years of the 21st century, representing an approximate compounded return of 1.2%. Of course, this would only occur if you had bought-n-held-hoped through all of the downturns – 2000-2002, 2007-2009, 2011, 2015. It gets worse. A 17.5% total return (1.2% compounded) looks even meeker up against an investment grade bond fund like PIMCO Total Return Fund (MUTF: PTTDX ). Assuming an absence of safe haven buying in the hypothetical bearish downturn and using just the performance numbers to date, the fund’s 160% since December 31, 1999 represents 7% annualized. That is for investment grade bonds, folks. “But Gary,” you protest. “You’re speaking in hypothetical scenarios. The return for SPY so far is actually 4.5% at a total return of 85%.” Fair enough. My questions to dismiss the thought process, then, are: (1) Do you believe that bear markets have been removed from the stock investing landscape and, (2) If you do believe in 30%-plus erosion of capital, what is your plan to minimize the damage? The way that I see it, central banks cannot eliminate the inevitability of recessions or bear markets. Moreover, I believe that we are closer to the next “common sense” recession than we are to extraordinary acceleration of the U.S economy. It follows that I have to prepare for the high likelihood of changes ahead. In an investing environment that – by most measures – is becoming increasingly fearful, I emphasize ETF assets on the far left and far right of the risk spectrum . On the right, I will maintain an allegiance to funds like the iShares MSCI USA Minimum Volatility ETF (NYSEARCA: USMV ), the Vanguard High Dividend Yield ETF (NYSEARCA: VYM ) and the Health Care Select Sect SPDR ETF (NYSEARCA: XLV ). They have given me little reason to cut back in that arena. I have even added a modest amount of stock risk to European exporters that might benefit from euro weakness via the iShares Currency Hedged MSCI Germany ETF (NYSEARCA: HEWG ). On the left, I remain dedicated to risk averse assets as I have throughout the prior 14 months. Long duration treasuries have provided remarkable relative value in a world where inferior country debt offers less yield than U.S. debt. I continue to be long ETFs like the Vanguard Extended Duration Treasury ETF (NYSEARCA: EDV ) and the iShares 20+ Year Treasury Bond ETF (NYSEARCA: TLT ). Taxable accounts have a variety of muni possibilities from the iShares National AMT-Free Muni Bond ETF (NYSEARCA: MUB ) to the BlackRock MuniAssets Fund (NYSE: MUA ). Perhaps most importantly, if a stock bear should be around the bend, I am able to use the FTSE Custom Multi-Asset Stock Hedge Index to my advantage. Not only did I join FTSE-Russell in creating the index that many are calling “MASH,” but I recognize the necessity of owning a diverse group of asset types to hedge against an extreme downturn in stocks. Long-dated treasuries, munis, gold, the Swiss Franc, the yen, the dollar, JGBs, German bunds, TIPS and zero coupons figure prominently in the index. Nobody knows when a bear market will emerge. Yet failing to prepare for a catastrophic decline is the worst mistake an investor can make. If nothing else, investors should recognize that the collapse in commodities, never-before-seen lows in global yields and the rapid appreciation of the almighty buck are more indicative of “risk-off” money movement than “risk-on” excitement. Disclosure: Gary Gordon, MS, CFP is the president of Pacific Park Financial, Inc., a Registered Investment Adviser with the SEC. Gary Gordon, Pacific Park Financial, Inc, and/or its clients may hold positions in the ETFs, mutual funds, and/or any investment asset mentioned above. The commentary does not constitute individualized investment advice. The opinions offered herein are not personalized recommendations to buy, sell or hold securities. At times, issuers of exchange-traded products compensate Pacific Park Financial, Inc. or its subsidiaries for advertising at the ETF Expert web site. ETF Expert content is created independently of any advertising relationships.