Tag Archives: management

Tactical Asset Allocation – My Ideas From 30 Years Of Learning

Summary How to create an investment portfolio using Tactical Asset Allocation. Three key measures I use are interest rates, valuation, and growth outlook. When selecting countries or regions, consider demographics, job growth, urbanization, debt levels, geo-political risk and currency effects. Tactical Asset Allocation (TAA) is defined as a dynamic investment strategy that actively adjusts a portfolio’s asset allocation . My goal in this article is to share with you the ideas that I have developed over the past 30 years, and to encourage discussion amongst readers, so as we can all learn from each other’s ideas and experiences. Introduction As a financial adviser, I must first consider a client’s risk profile. Younger clients with less capital invested will typically be prepared to take on more risk, and older clients will usually be comfortable taking on less risk. To keep it simple, I consider the following four asset classes: Cash, Bonds (CDs), Property and Equities. NB: I may also add Infrastructure (when interest rates are low to medium) or other sector funds, on occasion, as a small percentage of the portfolio. In determining my clients’ asset allocation, I consider the following factors: Interest rates Valuation Growth outlook Interest Rates The table below guides me, as does the 10-year Bond rate versus the equities dividend yield. BEST WORST Interest Rates Number 1 Number 2 Number 3 Number 4 Low (0-3%) Property Equities Bonds (CDs) Cash Medium (3-6%) High (6%+) Cash Bonds (CDs) Equities Property NB: The above % interest rates above are based on the reserve bank rate. Typically, the actual lending rates are around 2-3% higher. NB: When interest rates are “Medium” (3-6%), then their effect on the four asset classes is fairly neutral. Interest rates falling is better for bonds (CDs), property and equities. Interest rates rising is better for cash. Valuation My preferred valuation measures for asset allocation are: Price Earnings (P/E) Ratio : I look at a region or country’s P/E, both historical (last year’s earnings) and forward P/E, where available. My rule of thumb is to buy heavily as the P/E heads towards 10 and sell heavily as the P/E heads towards 20. A P/E of 15 is considered neutral. Having said that, I will also factor in interest rates. The Rule of 20 holds that P/E should be 20 minus the current interest rate. E.g., USA’s P/E should currently be 20 – 0.25 = 19.75. This makes allowance for times of extreme interest rates, as does the table below on interest rates. Long-term Charts of a Country’s Equity Index : Here, I simply view a 10- or 20-year chart and see if the index is above or below its trend line. Above being overvalued, below undervalued. Growth Outlook I will assess the following for a region’s or country’s growth outlook; GDP – Current year and forecast for next year. Earnings Per Share (EPS) – Forecast for next year. I will take a look at the following factors: Demographics – Is there a rising middle class, a growing work force or wealth effect? (You can read my article on demographics here , and the one on the rising Asian middle class here .) Job growth (unemployment) – Is the country gaining jobs? Urbanization – Is the country urbanizing? Debt levels – Are household debt levels low? Geopolitical risk and quality of government – Is there low geopolitical risk? Currency valuation – Is the currency undervalued? Trying to factor in all of the above is, of course, no easy task. Nor is it an exact science, but rather, is an art form, in my opinion. Having said that, I will give an example below of how I am currently (as of August 2015) recommending to my Australian clients, based on the above. Moderate-Risk Australian Client – $1m (AUD) Cash – 30% Bonds (Term Deposits, or TDs) – 0% Property – 20% Equities (comprising Asia) – 40% Sector funds – 10% (comprising Global Infrastructure – 5%, Global Resources – 5%) NB: TDs in Australia are the same as CDs in USA. Discussion on the above Tactical Asset Allocation Cash – 30% : Low percentage, as aggressive client and interest rates are very low. The reason to maintain 30% is to have cash available (to protect and invest) in case we see a severe market correction. Cash rates in Australia are still around 2.5% p.a. Bonds – 0% : Zero percentage, as interest rates are falling in Australia. 0% to International bonds, as the rates are already very low in developed markets. Could consider Asian or emerging market bond funds, where the rates are around 5-6% p.a., but there would be currency risk. Property – 10% in Australian-listed property : Low percentage due to earnings growth outlook being weak, with a weak Australian economy and rising unemployment. Low interest rates and fair valuation (P/E 15) suggest some exposure is necessary. Finally, most Australians already have very large $ exposure to an overvalued residential property sector. 10% in Global-listed property : Low interest rates are favourable and valuations fair. Equities – 40% : High percentage due to low interest rates, fair valuations in some regions/countries, strong growth prospects in Asia (demographics mostly good, rising middle class set to triple in size by 2020, according to DBS , with good jobs growth, urbanization, mostly low household and government debt levels, mostly low geo-political risk, and mostly good governments). Global Infrastructure – 5% : Low due to valuations being somewhat elevated. Could go to 10%, based on low global interest rates. Global Resources – 5% : Low, as this sector has been smashed down, and Asian demand for resources will pick up, with 290 million new homes required by 2020 and massive infrastructure projects planned. The valuations may look a bit high, but they are based on very low commodity prices at present. The following P/Es and growth outlook were part of the consideration. Australia: P/E – 15.67, Growth outlook – Poor Asia: P/E – 17.05, Growth outlook – Strong USA: P/E – 19.92, Growth outlook – Average-to-poor Europe: P/E – 19.11, Growth outlook – Average-to-poor Japan: P/E – 16.91, Growth outlook – Average-to-poor The above allocations will certainly lead to many debates, and this is healthy. US investors will naturally have more exposure to their local assets, which will avoid currency risk. They may choose to hold a percentage in US shares, given that the long-term outlook for US companies is strong. I do not disagree with that. My concerns are for non-US investors buying into the US late in the bull run, with a high valuation and a high USD. The main point of this article is to give investors some ideas on how they can go about building their portfolios, with consideration to both risk and return. For me, as discussed, I like to start with interest rates, then consider valuations and growth outlook. I always keep one eye on risk control and the other on optimizing returns, based on the client’s risk tolerance. Disclosure: I/we have no positions in any stocks mentioned, and no plans to initiate any positions within the next 72 hours. (More…) I wrote this article myself, and it expresses my own opinions. I am not receiving compensation for it (other than from Seeking Alpha). I have no business relationship with any company whose stock is mentioned in this article. Additional disclosure: The information in this article should not be relied upon as personal advice.
TerraForm Power: Go Long On Renewable Energy

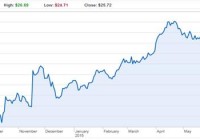
Summary TerraForm’s assets are new and efficient. Dividend guided by management to increase over 50% by 2017; yield on cost of 8% at currrent prices. Yieldco structure gives the company a highly visibile pipeline, external wind power acquisitions change the game. Shares are heavily undervalued at current prices. I’m long and you should be too. TerraForm Power, Inc. (NASDAQ: TERP ) is one of a few relatively new yieldcos trading in the market today. The company was set up to operate SunEdison (NYSE: SUNE ) assets in solar energy, but has since expanded to offer wind energy production as well. The current portfolio totaled 1,883 MW at the end of Q2 2015, but there has been 788MW worth of acquisitions already announced in 2015 and the company has call rights on 3,716MW of production that is under construction by SunEdison. Currently, the majority of assets are held in the United States (71%) and the United Kingdom (20%). From a management perspective, the relationship between TerraForm and SunEdison means that investors stand to benefit from SunEdison’s expertise as a large player in renewable energy design and downstream operations. The majority of TerraForm Power management worked at SunEdison so there is deep industry knowledge in the management suite in regards to predicting capital expenditures and industry ties to other third parties in the industry. Yieldcos have increased in popularity over the past few years, especially within the renewable energy space. Investors new to the concept can view a yieldco in a similar light to the more familiar master limited partnership (MLP) structure. Yieldcos do not pay corporate taxes and only completed, revenue-generating assets are held within the structure, attracting investors seeking low risk and stable cash flow. In return, parent companies get access to lower costs-of-capital while still retaining the majority voting interest on their assets. (click to enlarge) Shares have taken a dive in July and now trade below the initial IPO price in 2014. Is this warranted or does the company present a substantial opportunity at current prices? What steps has management taken over the past year and how does the asset pipeline look? Wind Diversification TerraForm has significantly diversified its power generation into wind assets in 2015. Starting with the FirstWind acquisition that closed in 2015 (500 MW), the company acquired an additional 1,451MW of wind energy from Atlantic Power and Invenergy in June/July 2015. By the end of 2015, all these transactions will have closed and TerraForm will be one of the largest wind power providers in the United States from basically having no wind assets just a year ago. In fact, starting in 2016 TerraForm will derive more power generation from wind than solar. This was a big deal for the company and these transactions catapulted TerraForm forward in the renewable energy markets. I like these acquisitions as they diversify the revenue base and will enhance scale in what currently is a highly fragmented renewable energy market. For a company that many viewed a year ago as just a depository for SunEdison solar assets, this has been a major change and management has a vision for the future. High Leverage Does Present Risks Due to the capital-intensive nature of the business and the corporate structure, traditional metrics like net debt/EBITDA and others are high. Current net debt/run-rate EBITDA stands at 5.1x, which should be something investors weigh before opening a position. Recent cash raises in the equity/debt markets have been all but used up to fund the recent transformative acquisitions mentioned. Current liquidity stands at just $646M (only $50M cash-on-hand plus the open revolver balance). Going forward in the short term, TerraForm’s large transactions are over in my opinion and the company will switch gears to focus on integration and cultivating existing production. Dividend Growth and Eventual Share Price The 2015 dividend is set to be $1.35/share, an annual rate of 4.46% at current prices. However, management has guided for the dividend to increase to $1.75/share in 2016 and $2.05/share in 2017. (click to enlarge) * TerraForm Investor Presentation At current prices of $25.33/share as of this writing, a dividend of $2.05/share in 2017 would give you a yield on cost of over 8% on your original investment. This is extremely solid and I think the market must either not understand the company or believe it cannot meet its dividend growth goals, which have been reiterated quite often in calls. Analysts have been quite direct on management’s view of share value and whether issuing further equity in the pipeline, to which Management has responded adamantly that they view the shares as undervalued at current prices and do not wish to raise capital this way. I think it is unlikely that current shareholders get diluted at current prices. Conclusion Shares are undervalued at current prices and the market sell-off from $40/share to current lows has been overdone. I picked up some shares at current prices today (to go along with my other two utility plays, Calpine Corporation (NYSE: CPN ) and AES Corporation (NYSE: AES )). In general, I think investors in utilities should seek out companies with young power plants with significant holdings in the next generation of power generation (natural gas, wind, solar) at cheap prices. TerraForm fits the bill. Disclosure: I am/we are long TERP. (More…) I wrote this article myself, and it expresses my own opinions. I am not receiving compensation for it (other than from Seeking Alpha). I have no business relationship with any company whose stock is mentioned in this article.

SRV: Trading At 20%+ Discount To NAV Due To Supply/Demand Imbalance

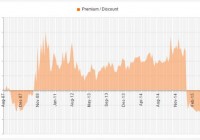
Summary Wave of investor outflows has created a significant dislocation. This provides an opportunity for those constructive on the MLP sector to obtain cheap exposure. For others, it also presents some potential to capture alpha through pair trades. Background on Closed-End Funds For those new to the space, a closed-end fund is a publicly traded investment company that raises a fixed amount of capital, and is then structured, listed and traded like a stock on a stock exchange. Whereas conventional mutual funds and ETFs frequently redeem/issue new shares to ensure that the price per share remains in line with the net asset value of the underlying holdings in the funds, this is not the case for CEFs. Rather, the share price of CEFs is driven by the market forces of supply and demand, which sometimes creates attractive opportunities to buy stakes at big discounts to NAV. This tends to happen when sentiment for the particular sector on which a CEF focuses gets decimated, causing some investors to sell irrespective of price. MLPs are one area where we can see this phenomenon most prevalently today. Amidst plummeting commodity prices and rising rate concerns, investor outflows have caused several MLP-focused CEFs to trade at among the widest discounts to NAV in the CEF universe. This presents some opportunities for those that desire cheap exposure to the sector, as well as those that are agnostic on the sector and just want to collect some alpha. Though there are a few examples of other funds worth considering, including Kayne Anderson Energy Development Co (NYSE: KED ) and Cushing Royalty & Income Fund (NYSE: SRF ), in this article, I focus on the Cushing MLP Total Return Fund (NYSE: SRV ) mainly due to the benefits of its large/liquid portfolio and relatively high institutional ownership. As shown below, SRV is currently trading at a ~22% discount to NAV. (click to enlarge) Source: CEF Connect Cushing MLP Total Return Fund Overview SRV is a moderately sized/liquid fund launched in late 2007, which currently has approximately $209 million of total net asset value. The fund’s mandate is to obtain capital appreciation and current income, typically by investing at least 80% of its NAV in MLPs based upon bottom-up fundamental research. The two partners overseeing the fund (bios included here ) each have several decades of experience in the space. The fund’s performance since inception has been poor, at approximately -7% per annum. However, this largely reflects the general downturn in MLPs/commodities over this period as opposed to poor security selection. As shown below, the current portfolio is diversified across a number of MLP subsectors, and is composed of mostly relatively large, liquid names. Annual portfolio turnover is relatively high (~137%), which I view as a marginal negative due to the fact that this can lead to somewhat higher transaction costs. The fund’s annual management fee is moderate at 0.75%, but its total expense ratio (excluding interest and dividends) is higher than average at approximately 2.6% of NAV. Unlike direct holdings in MLPs, SRV does not generate unrelated business taxable income, and Cushing therefore notes that the fund is suitable for IRAs and other tax-exempt accounts. Source: Cushing What will Cause the Discount to Compress? Whenever sentiment in the MLP sector eventually stabilizes and net investor outflows dry up, it is likely that much of SRV’s discount to NAV will naturally dissipate (for the bulk of the fund’s life, it has actually traded at a premium to NAV as can be seen in the first chart above). However, even if simple supply/demand do not naturally compress the discount, there are a couple of other drivers that could. First, SRV has a moderate annual distribution yield of 6.75% (based on current market price). As part of this represents return of capital, the fund partially self-liquidates over time. In addition, the fund has a reasonably concentrated investor base compared to its peers, with institutions holding approximately 24% of shares outstanding. To the extent that a significant discount were to persist over time, these large investors would be incentivized to pressure management to take additional steps to reduce it (e.g., through buybacks or increased distributions). Source: Nasdaq Trade Structuring For investors that want exposure to MLPs, this CEF provides cheap exposure. However, it also presents some potential opportunity to collect alpha for those that are agnostic (or negative) on the space, through pairing a long position in SRV with a short position in an MLP ETF (either through outright equity or options). Though there are several possible shorts to consider, one of the most actionable is the ALPS Alerian MLP ETF (NYSEARCA: AMLP ). This is a large ETF with approximately $8.4 billion of net assets and average daily trading volume of ~$72 million. It is currently relatively easy to borrow, with a rebate rate under -3.5% through some retail brokers, and also has listed options (which can enable investors to avoid dividend costs). The fund seeks to track the Alerian MLP Infrastructure Index, and 7 of its top 10 holdings overlap with SRV’s top 10. Risks/Considerations The obvious risk of this trade is that the timing of discount convergence is unclear, and if investors’ macro fears over commodities/rates grow, there is a possibility that the discount could grow even larger over the near term. The main mitigants are the facts that, as discussed above, the investor base is relatively concentrated with institutional investors, and the fund pays a moderate distribution yield. Short selling, of course, also comes with added risks (e.g., possibility of force buy-ins, increasing borrow costs, etc.) and likely should not be attempted by those new to the market. Disclosure: I/we have no positions in any stocks mentioned, but may initiate a long position in SRV over the next 72 hours. (More…) I wrote this article myself, and it expresses my own opinions. I am not receiving compensation for it (other than from Seeking Alpha). I have no business relationship with any company whose stock is mentioned in this article.