Tag Archives: management

The 4% Spending Rule: Golden Rule Or Guideline?
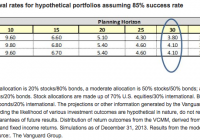
Summary Today’s environment of high equity valuations and low interest rates shouldn’t be ignored. Are investment costs a factor, and if so, how much? Embrace a dynamic spending strategy that considers market performance and allows for flexibility each year. By Maria Bruno, CFP Hardly, a week goes by without seeing some type of headline news discussing the viability of the venerable 4% spending rule. Indeed a simple internet search will yield more than 5 million results! It’s no wonder that retirees may be more confused now than ever. It’s hard to believe that 20 years have passed since William Bengen published his research about sustainable retirement withdrawal rates.[1] During this time, many researchers (including those at Vanguard) have discussed, debated, and continued to crunch the numbers. Much has occurred in the capital markets, including three bull markets, two bear markets, and historically low fixed income yields. Given the milestone anniversary, it’s a good time to reflect, and there’s no better way to start than by defining what the guideline means. Simply put, the 4% spending guideline stated that retirees with a diversified portfolio split between stocks and bonds could safely withdraw 4% of their initial balance at retirement, adjusting the dollar amount for inflation each year thereafter. This level of spending was intended to provide a stable, inflation-adjusted income stream that had a strong likelihood of being sustained for 30 years, based on historical returns for stocks and bonds. Why does the 4% spending rule get a bad rap? First, much of the earlier research was based on modeling of historical asset class returns. While this approach has its merits, the major limitation is that it doesn’t consider current market and economic conditions. In today’s environment of elevated equity valuations and sustained low interest rates, these factors can’t be ignored. To that end, Vanguard’s research incorporates the current market and economic environment in its long-term projections. (See Figure 1.) Second, most well-thought-out research frames the 4% target as a rule of thumb with trade-offs. As with anything in financial planning, guidelines are a starting point and shouldn’t be taken as much more than that. Retirees need to consider their own personal situations when in managing longevity risk-such as their goals, planning horizon, portfolio composition, and comfort level with “stress testing” different market and spending scenarios. Third, the rule of thumb assumes a dollar inflation-adjusted spending program. This means that, at retirement, the retiree spends 4% of his or her portfolio and adjusts that amount annually for inflation. In reality, very few retirees actually stick with such a strict policy. Further, and more important, following an inflation-adjusted spending strategy exposes the retiree to “sequence of returns” risk. With such a model, the spending amount is adjusted annually for inflation but completely ignores portfolio performance. In periods of sustained poor market performance, particularly at the onset of retirement, the retiree is actually spending a greater percentage and, if left unchecked, exposes the portfolio to premature depletion. Indeed, this is one of the major risks of the 4% spending rule. Sure, costs matter, but how much? Many of the published studies show simulated outcomes using benchmark returns as a proxy, with no consideration of real-life costs such as taxes and investment fees. In our studies, we further analyzed hypothetical cost scenarios to stress test portfolio durability using the 4% spending guideline. In the chart above, we highlighted sustainable withdrawal rate durability at an 85% success rate, meaning that in 85% of the simulations the portfolio lasted for at least 30 years. We simulated reductions for cost-0 cost represents the benchmark, 0.25% represents a lower-cost portfolio, and 1.25% represents a higher-cost portfolio (see Figure 2). The results are rather eye-opening. For a moderate investor, the success rates drop from 84% to 74% when higher costs were used. What this means is that the risk of running out of money moved from a 16% to 26%, and the sole factor was investment costs, which is one of the main things that investors can control! No doubt that spending in retirement will continue to be at the forefront of retirees’ minds for the next 20 years. Here’s how I suggest retirees approach the 4% spending rule. First , they should maintain the perspective that this type of analysis should only be used as a modeling tool to help gauge portfolio durability simulations, assuming you maintain a balanced and diversified portfolio. Second , portfolio management costs are a “drag” on their spending, so it’s important to minimize investment costs and follow a tax-efficient portfolio spending approach. Third , they should embrace a dynamic spending strategy that considers market performance and allows for flexibility on an annual basis. Certainly, these three principles are general in nature, but they can provide investors with a nice tailwind as they head into retirement. I’d like to thank my colleagues Michael DiJoseph and Yan Zilbering for their contributions to this research. For more information on dynamic spending, see Vanguard’s research . Footnotes William P. Bengen, 1994. Determining withdrawal rates using historical data. Journal of Financial Planning (October):171-180. Notes IMPORTANT: The projections or other information generated by the Vanguard Capital Markets Model regarding the likelihood of various investment outcomes are hypothetical in nature, do not reflect actual investment results, and are not guarantees of future results. VCMM results will vary with each use and over time. The VCMM projections are based on a statistical analysis of historical data. Future returns may behave differently from the historical patterns captured in the VCMM. More important, the VCMM may be underestimating extreme negative scenarios unobserved in the historical period on which the model estimation is based. All investments are subject to risk. There is no guarantee that any particular asset allocation or mix of funds will meet your investment objectives or provide you with a given level of income. Diversification does not ensure a profit or protect against a loss in a declining market. The Vanguard Capital Markets Model® is a proprietary financial simulation tool developed and maintained by Vanguard’s primary investment research and advice teams. The model forecasts distributions of future returns for a wide array of broad asset classes. Those asset classes include U.S. and international equity markets, several maturities of the U.S. Treasury and corporate fixed income markets, international fixed income markets, U.S. money markets, commodities, and certain alternative investment strategies. The theoretical and empirical foundation for the Vanguard Capital Markets Model is that the returns of various asset classes reflect the compensation investors require for bearing different types of systematic risk (beta). At the core of the model are estimates of the dynamic statistical relationship between risk factors and asset returns, obtained from statistical analysis based on available monthly financial and economic data from as early as 1960. Using a system of estimated equations, the model then applies a Monte Carlo simulation method to project the estimated interrelationships among risk factors and asset classes as well as uncertainty and randomness over time. The model generates a large set of simulated outcomes for each asset class over several time horizons. Forecasts are obtained by computing measures of central tendency in these simulations. Results produced by the tool will vary with each use and over time.
EVX: Cash In Trash

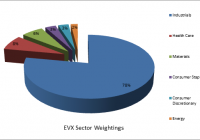
Proper waste management has been largely ignored by newly emerged economies. Legislation in advanced economies has necessitated the creation of a waste management industry. The Market Vectors ETF contains top-tier companies as well as very specialized waste management companies. Over the past twenty years or so, many nations discovered that socialist economic management, although noble in concept, was impractical in reality. Nations such as China, India, Russia, Eastern Europe and many South American nations pursued and adopted “free market principles” with great success. Literally millions upon millions have risen out of poverty and have attained a better standard of living. However, as so often happens in emerging markets, environmental sustainability took a back seat to economic development. The rapid industrial expansion may well have created a global “climate change”. It certainly has created dangerous levels of smog and air pollution in many of the world’s most famous cities. Several of the world’s great rivers have become polluted and nearly devoid of life. One critical problem that has hardly been addressed is the various kinds of solid waste; everything from industrial waste down to the trash generated, by each of us, every day. Van Eck Global offers investors a way to benefit from a niche market through its Market Vectors ETF Environmental Services ETF (NYSEARCA: EVX ) . The fund tracks the performance of the NYSE Arca Environmental Services Index (AXENV) : a modified equal dollar-weighted index intended to give investors exposure to the environmental services sector. A word of caution: This is a very thinly traded specialized fund so it may not be a suitable holding for all investors. However, it does contain well-known, well-established, dividend-paying companies. Hence, the questions are whether it’s worth holding the fund, or simply selecting individual companies. Since there are only 23 companies in the fund as of the first week of August 2015, it would be best to break the holdings down into their respective sectors and identify both strong and weak points. First, the fund is comprised almost entirely of US-based companies, 96.4%, and also a few Canadian holdings, 3.6%. This is an important point. Both governments have long established legislation on environmental issues, including the proper, safe and sustainable disposal of industrial and residential waste, for one example, the Ocean Dumping Ban Act of 1988 . Further, legislation is far from complete. Individual US states have their own requirements. The point being that there is a demand for the management of waste necessitated by laws and regulations. Further, laws, regulations, certifications, permits, specialized equipments and procedures are required to collect, transport and dispose of medical waste. A quick examination of the top ten holdings demonstrates the general waste management industry as well as the lesser-known specialized waste management companies. In fact, potential investors might even find the services offered as unique, interesting, and without a doubt critically necessary. Company and Symbol Percentage of Fund’s Holdings Recent TTM P/E Recent EPS Recent Dividend Yield Industry Specialization What They Do Waste Management (NYSE: WM ) 11.09% 23.36 $2.17 3.03% Industrial Provides waste management through local subsidiaries. Collects, transports, recycles: paper, glass, plastics, metal, electronics. Owns landfill and landfill gas-to-energy facilities. Republic Services (NYSE: RSG ) 10.99% 25.23 1.69 2.82% Industrial Similar to Waste Management, collecting, transporting and recycling non-hazardous residential, municipal and industrial solid waste. Waste Connections (NYSE: WCN ) 10.61% 26.89 1.85 1.05% Industrial and Minerals Diversified. Managing, collecting, transferring, disposing and recycling of municipal and residential wastes. Recycles paper, glass, metals and compostable waste, as well as non-hazardous natural resource exploration wastes. Stericycle (NASDAQ: SRCL ) 10.70% 40.91 3.49 0.00% Healthcare Services Provides consulting and regulated compliant solutions for healthcare and commercial businesses. Subsidiaries in the Americas, Europe, and the Pacific. Collections include “sharps”, pharma, blood, dental, used safety products and veterinary waste. Steris Corp. (NYSE: STE ) 3.88% 29.92 2.25 1.49% Healthcare Services Medical sterilization equipment and services. Disinfection systems, surgical tables, OR storage, scrub sinks; OR and GI procedure accessories; patient tracking; cleansing products. Some brand names: Amsco, Hamo, Cmax, Reliance and Harmony Tetra (NASDAQ: TTEK ) 3.77% 17.57 1.50 1.22% Materials and Energy Engineering and consulting services; water management and infrastructure, oil sands, geotechnical and Arctic engineering services. Operates in Canada as well as the US. Cantel Medical Corp. (NYSE: CMN ) 3.74% 49.40 1.09 0.19% Healthcare Services/Consumer Products Infection Prevention; GI equipment reprocessing, sterilants, detergents; disposable healthcare products; dialysis disinfection; biological packaging; and water purification. US, Canada and Puerto Rico. Progressive Waste Solutions (NYSE: BIN ) 3.69% 26.77 1.02 1.92% Industrial Municipal and residential waste management; landscape collection and recycling, recycling centers and landfill operations; portable toilets; waste audits and education/event services. Serves US, and Canada. ABM Industries (NYSE: ABM ) 3.68% 22.72 1.45 1.94% Industrial Provides integrated facilities solutions for commercial, government, institutions, hotel, airports, data centers, high-tech manufacturing. Commercial cleaning, maintenance and repair, HVAC maintenance, janitorial, security, parking management. US and Canada. US Ecology, Inc. (NASDAQ: ECOL ) 3.56% 35.22 1.38 1.48% Industrial/ Mineral Collection, transportation, treatment, disposal, recycling of hazardous, non-hazardous, and radioactive wastes. Chemical cleaning, decontamination, spill and emergency response. Operates in US and Canada. (Data from Van Eck and Reuters) Overall, 5 of all 21 holdings have a negative trailing twelve-month (TTM) EPS. The fund’s average EPS is positive at 0.96. The average TTM P/E is 25.5195 and the average dividend yield is 1.23%. The fund has a total of $15.6 million in total net assets. Its gross expense ratio is somewhat high at 0.92%, however, according to Van Eck, expenses for the fund are capped at 0.55% through January of 2016. As noted above, the fund is very thinly traded averaging 250 shares per day, over the past 30 days. The fund is currently trading at a slight premium to NAV of 0.03%. The share price was $62.51 as of the close on August 7, $0.03 over the NAV. The following table is a summary of the fund’s basic metrics: 1 Month 3 Months YTD 1 Year 3 Year 5 Year Since Inception 10/10/06 EVX -0.54 -1.1 -4.51 -2.32 9.82 8.67 6.45 EVX Shares -0.65 -1.55 -6.04 -4.37 9.67 8.57 6.41 AXENV Index -0.5 -1.01 -4.45 -2.16 10.29 9.20 6.99 (Data from Van Eck) Lastly, the fund pays a yearly dividend, as summarized in the table: (Data from Van Eck) A word or two needs to be said about a few of the holdings. For example, Newpark Resources (NYSE: NR ) , 2.01% of the holdings, is actually an oil and gas driller and only loosely connected to the management of resource waste management, per se. The company emphasizes its corporate responsibility to the environment as a provider of sustainable and ecologically-friendly drilling services in the industry. Needless to say, the company has been affected recently by overproduction in the oil and gas industry. Tenneco (NYSE: TEN ) , 3.00%, manufactures catalytic converters and diesel oxidation catalysts for combustion engines, thus indirectly managing carbon emission waste. Schnitzer Steel (NASDAQ: SCHN ) , 1.80%, specializes in large-scale metals shredding, blending and recycling to customer specifications, thus reducing landfill waste. Layne Christensen (NASDAQ: LAYN ), 1.86%, specializes in water management, drilling and construction. Darling Ingredients (NYSE: DAR ) , 3.03%, manufactures sustainable natural ingredients for edible and inedible bio-nutrients. These examples demonstrate that not every holding is a “pure-play”, which goes “out into the field”. They and others in the fund recycle or repurpose what would otherwise be an unusable waste product. However, all of the companies do relate to the central theme of hazardous and non-hazardous waste management: transportation, recycling, repurposing, filtration, disposal and also environmental consulting services. Since the sector has so few participants, it’s reasonable to consider the potential of competition and then pricing power. It’s reasonable, but not likely as EPA regulations require licensing, certification, inspection and needless to say accountability if something should go wrong. Thus, it would be difficult, expensive and time consuming for new entrants to establish themselves in this sector. On the other hand, an outright purchase of an established specialized waste management company would be far simpler. Recent headline-making events such as oil drilling accidents, freight train derailments causing chemical spills and fires requiring the evacuations of entire towns, coal wastewater ponds leaking into the water table, difficult or untreatable hospital infections, salmonella bacterial contamination in food production, contaminated HVAC cooling towers causing the often fatal Legionnaires’ disease, all indicate the growing need to fill a large niche for private sector investment. The Van Eck Market Vectors ETF is one of the few funds which specialize in environmental service. The companies in this fund are mostly profitable to the point of paying dividends. Once more, the lack of a market for the ETF shares will make this difficult to trade. But the fund will give a long-term investor with a little extra risk capital and patience, an opportunity to hold a diversified position in a growing industry, increasingly mandated by law and public demand. Disclosure: I/we have no positions in any stocks mentioned, and no plans to initiate any positions within the next 72 hours. (More…) I wrote this article myself, and it expresses my own opinions. I am not receiving compensation for it (other than from Seeking Alpha). I have no business relationship with any company whose stock is mentioned in this article. Additional disclosure: CFDs, spread betting and FX can result in losses exceeding your initial deposit. They are not suitable for everyone, so please ensure you understand the risks. Seek independent financial advice if necessary. Nothing in this article should be considered a personal recommendation. It does not account for your personal circumstances or appetite for risk.

Could A Strike Of The South African Gold Miners Push GLD Higher?

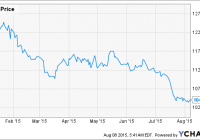
Summary All the three major labor unions in the South African gold mining industry rejected the proposed 13% pay hike. The labor unions demand 70%-100% increase of wages. The South African gold producers can’t afford to increase wages too much as labor costs are said to represent approximately 50% of gold mining costs in South Africa. A probable strike may help to support gold and GLD prices; however, it won’t push too them much higher, as the South African gold production isn’t important enough. As the gold price stabilizes in the tight range between $1,080 and $1,100 per troy ounce (toz), the SPDR Gold Trust ETF (NYSEARCA: GLD ) found its short term support at the $104 level. Although the long-term fundamentals are positive, the short-term development of the GLD share price is questionable. But the current developments in South Africa indicate that GLD may bounce off the recent lows. On August 2 , The Association of Mineworkers and Construction Union that represents approximately one third of South African gold miners, rejected a 13% pay hike proposal. On August 7 , the National Union of Mineworkers did the same. Although the offer has been increased to a 17% pay hike, the unions demand an increase by 70-100%. Basic monthly wage is approximately $460 right now which really isn’t too much, given the harsh working conditions in South African gold mines. On the other hand wage costs are said to represent approximately 50% of gold mining costs in South Africa. This claim is supported by a 2011 estimate that labour costs account for 38% of total operating expenditures. It means that increasing wages by the rejected 13% or 17% would be extremely painful for gold producers given the current gold price. Increasing wages by 100% would ruin them. The South African gold producers can’t afford to increase wages too much. The discussions should continue on Wednesday but the difference between the demands of the miners and offers of the mining companies is still very large. The general secretary of the National Union of Mineworkers claimed that they will go on strike if their demands are not met. The situation will most probably escalate in the coming weeks, however impacts of the possible strike on gold and GLD prices is questionable. South Africa And Gold Mining Although South Africa was the world’s biggest gold producer for the better part of the 20th century, its position has deteriorated significantly lately. According to the USGS data, South Africa produced approximately 150 tonnes gold in 2014. It equals to approximately 4.823 million toz. On the other hand China, the world’s biggest gold producer, mined 450 tonnes (14.468 million toz) gold and the total global gold production amounted 2,860 tonnes (91.951 million toz). It means that South Africa was the 5th biggest gold producer in 2014 (the 5th position is shared with Peru) and only 5.24% of the 2014 global gold production was attributable to this country. (click to enlarge) Source: own processing, using data of USGS Only 20 years ago, South Africa was the world’s biggest gold producer by far. It produced 580 tonnes (18.647 million toz) gold in 1994, which represented more than 25% of the global production. But poor infrastructure, labor problems and the fact that the miners must dig for gold deeper and deeper, resulted in a continuous decline of South African gold production. The South African gold production declined by 74% between 1994 and 2014, while the global gold production increased by 24% during the same time period. (click to enlarge) Source: own processing, using data of USGS The problems of the South African gold industry are well illustrated by the fact that 8 out of the 10 deepest mines are located in South Africa (chart below) and all of them produce gold. The world’s deepest mine, Mponeng , is owned by AngloGold Ashanti, which produces 405,000 toz gold per year and the operating depth ranged from 2,400 to 3,900 meters below surface in 2012. The mine life should be expanded to 2040 which means that the miners will probably dig much deeper. Source: own processing, using data of mining-technology.com Can the strike alone push GLD price higher? The strike alone probably won’t be enough to push gold and GLD price too much higher. South Africa is responsible for only slightly more than 5% of global gold production. In the case that all of the South African gold production would stop (which is not probable), global gold market would lost only slightly more than 0.4% of annual mine supply every month. And there is another problem. There was a major strike of the platinum miners last year in South Africa. The strike took place from January to June and some of the world’s biggest platinum producers (Lonmin ( OTCPK:LNMIY ), AngloAmerican Platinum ( OTCPK:AGPPY ), Impala Platinum ( OTCQX:IMPUY )) were affected. But the platinum price was relatively stable. The chart below shows price development of ETFS Physical Platinum Shares ETF (NYSEARCA: PPLT ), ETFS Physical Palladium SHares ETF (NYSEARCA: PALL ), GLD and iShares Silver Trust ETF (NYSEARCA: SLV ). Share prices of all of the funds increased by 5-9% during the first half of 2014. Only palladium price increased more significantly, mainly due to the problems between Ukraine and Russia that is the world’s biggest palladium producer. Platinum and PPLT prices increased by less than 10% although South Africa is world’s biggest platinum producer and it was responsible for 72% of global platinum production in 2013, the year before the strike. The reason is that platinum producers were processing the stockpiled material. If the South African gold miners have stockpiles large enough, a similar scenario may repeat itself this time again. It means that the strike alone doesn’t have the potential to push gold price notably higher, however it may have a positive psychological effect and it may help gold and GLD prices to hold above the current support levels. Conclusion All in all, the possible strike of the South African gold miners doesn’t have the potential to move gold and GLD prices significantly. South Africa is not that important gold producer anymore. Moreover the miners have probably some stockpiled material that may help to offset the impacts of the strike for some time. On the other if there is a strike, it may have a positive psychological impact on markets and given that GLD price is consolidating above the $104 level and most of the gold producers are unable to generate any profit at current gold prices, it may help to avoid further price declines in the short term. Disclosure: I/we have no positions in any stocks mentioned, and no plans to initiate any positions within the next 72 hours. (More…) I wrote this article myself, and it expresses my own opinions. I am not receiving compensation for it (other than from Seeking Alpha). I have no business relationship with any company whose stock is mentioned in this article.