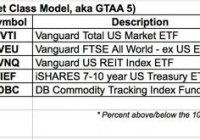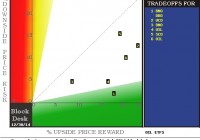
Summary Oil-price ETFs provide a quick look at expectations for change prospects in Crude Oil commodity prices. Market-maker hedging in these ETFs provide an overlay in terms of their impressions of likely big-money client influences on Oil-based ETF prices. But is there a broader story in price expectations for natural gas? And for ETFs in NatGas, following the same line of reasoning? Change is coming, so is Christmas But in what year? Expert oil industry analyst Richard Zeits in his recent article points out how long prior crude oil price recovery cycles have taken, with knowledgeable perspectives as to why. Still, there is also a suggestion that differences could exist in the present situation. Past cruise-ship price experiences of Crude Oil investors on their VLCC-type vessels have marveled at how long it takes to “change course and speed” in an industry so huge, complex, and geographically pervasive. To expect the navigating agility of an America’s Cup racer is wholly unrealistic. Yet some large part of the industry’s present supply-demand imbalance is being laid at the well-pad of new technology and aggressive new players in the game. In an effort to explore the daisy chain of anticipations that may ultimately be reflected by a persistent directional change in the obvious scorecard of COMEX/ICE market quotes, let’s step back a few paces from the supply~demand balance of commercial spot-market commodity transactions to the futures markets on which are based ETF securities whose prospects for price change attract investors in such volume that ETF markets require help from professional market-makers to commit firm capital to temporary at-risk positions that provide the buyer~seller balance permitting those transactions to take place. But that happens only after the market pros protect their risked capital with hedges in the derivative markets of futures and options, which doing so, quite likely provide some much lesser fine-tuning back into the price contemplations back up the ladder that brought us down to this level of minutia. So where to start? Mr. Zeits regularly asserts that his analyses are not investment recommendations, so securities prices are typically unmentioned, and left to the reader’s cogitation. We will start at the other end, where you can be assured that our thinking is in strong agreement with Mr.Z at his end. We convert (by unchanging, logical systemic means, established well over a decade ago) the market-makers [MMs] hedging actions into explicit price ranges that reflect their willingness to buy price protection than to have their perpetual adversaries in (and of) the marketplace take their capital (perhaps more brutally) from them. Using Richard Z’s list of Oil ETFs, here is a current picture of what the MM’s hedging actions now indicate are the upside price changes possible in the next few (3-4) months that could hurt them if their capital was in short positions. The complement to that, price change possibilities to the downside, could be a yin to the upside move’s yang, but we have found better guidance for the long-position investor’s concern in the actual worst-case price drawdowns during subsequent comparable holding periods to the upside prospects. So this map presents the upside gain potentials on the horizontal scale in the green area at the bottom, with the typical actual downside risk exposure experiences on the vertical red risk scale on the left. The intersection of the two locates the numbered ETFs listed in the blue field. (used with permission) Here’s the cast of characters: [1] is United States Brent Oil ETF (NYSEARCA: BNO ) and PowerShares DB Oil ETF (NYSEARCA: DBO ); [2] is ProShares Ultra Bloomberg Crude Oil ETF (NYSEARCA: UCO ); [3] is United States Short Oil ETF (NYSEARCA: DNO ); [4] is United States 12 month Oil ETF (NYSEARCA: USL ); [5] is ProShares Ultra Short Bloomberg Crude Oil ETF (NYSEARCA: SCO ); and [6] is the iPath S&P GSCI Crude Oil Price Index ETN (NYSEARCA: OIL ). Here is how they differ from one another: All are ETFs except for OIL, an ET Note with trivially higher credit risk and possible slight ultimate transaction problems. All except BNO are based on West Texas Intermediate [wti] crude oil availability and product specs, BNO is based on Brent (North Sea oil) quotes, directly influenced by ex-USA supply and demand balances. Most prices are at spot or most immediate futures price quotes, but USL is an average of the nearest-in-time 12 months futures quotes. All are long-posture investments except for SCO and DNO which are of inverse [short] structure. Both UCO and SCO are structured to have ETF movements daily of 2x the long or short equivalent unleveraged ETFs. What is the Reward~Risk map telling us? For conventional long-position investors, items down and to the right in the green area are attractive, to the extent that their 5 to 1 or better tradeoffs of upside potentials to bad experiences (after similar forecasts) are competitive to alternative choices. The closer any subject is to the lower-left home-plate of zero risk, zero return, the less attractive it is to those not traumatized by bunker mentality. SCO, the 2x leveraged short of WTI crude has a +20% upside with a -16% price drawdown average experience with similar forecasts in the past 5 years. It is a slightly better reward than a bet on a long position in Brent Crude and DNO, whose +18% upside is coupled with only -2% drawdowns. SCO’s minor return advantage over DNO comes largely from its leverage which is responsible for its large risk exposure. The same is true for UCO. USL’s trade-off risk advantage over OIL comes largely from smaller volatility in the 12-month average of futures prices that it tracks, rather than only the “front” or near expiration month. Here are the historical details and the current forecasts behind the map. The layout is in the format used daily in our topTen analysis of our 2,000+ ranked population of stocks and ETFs. For further explanation, check blockdesk.com . (click to enlarge) Conclusion In general, this map suggests that we still have ahead of us some further price declines as crude oil equity investors (via ETFs) see advantages in short structures. The spread between WTI crude price and Brent crude may be as narrow now as is likely in the next few months, given BNO’s relative attractiveness here. This analysis will be followed shortly by a parallel on those ETFs focused on Natural Gas and alternative energy fuels.