Stock Traders Flock Back To Gold ETFs
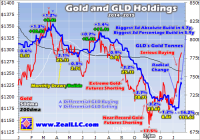
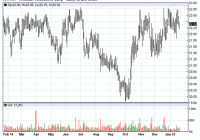
American stock investors and speculators started pouring capital back into gold this week in a serious way, aggressively buying GLD ETF shares. This buying was so massive that GLD had to shunt enough stock capital into physical gold bullion to grow its holdings by their fastest pace in about 5 years. And this is likely just the beginning, as American stock investors remain woefully underinvested in gold and not prudently diversified. Gold surged this week on massive buying from stock investors and speculators. This critical group of traders and their vast pools of capital utterly abandoned gold in the past couple years. So to see them start to flock back is a watershed event, heralding a major reversal in gold’s fortunes. And with their gold exposure remaining near extreme lows, they have vast buying left to do to restore prudent portfolio diversification. Successful investors have always practiced this essential concept of not putting all their eggs in one basket. This great wisdom is ancient, stretching back at least three millennia to King Solomon’s reign in ancient Israel. In the Biblical book of Ecclesiastes he advised, “Invest in seven ventures, yes, in eight; you do not know what disaster may come upon the land.” Portfolio diversification is absolutely critical. Most investors today keep the vast majority of their capital in stocks and bonds, which is fine. But truly wise ones also diversify into alternative investments , which simply mean not stocks, bonds, or cash. Gold has always been the leading alternative asset, largely thanks to its strong negative correlation with the stock markets. Gold thrives when stocks are weak, making it indispensable to managing overall portfolio risk. American stock investors’ preferred vehicle for diversifying into gold is the flagship SPDR Gold Trust ETF (NYSEARCA: GLD ). This is the world’s largest gold ETF by far, and offers some great advantages to stock traders. They can instantly buy or sell GLD shares, gaining or shedding gold exposure, with normal stock-trading accounts. And this is very efficient, with very low transaction costs. GLD’s mission is to track the gold price, which it has done flawlessly since its birth in November 2004. Investors and speculators owning GLD shares get gold-price exposure that’s virtually identical to gold’s underlying price moves. Achieving this mirroring isn’t trivial for GLD’s custodians, because the real-time supply and demand of GLD shares rarely matches gold’s own. That requires GLD to act as a conduit . When stock traders buy GLD shares faster than gold itself is being bought, they threaten to decouple to the upside. That would cause GLD to fail its tracking mission. So its custodians quickly step into the markets to offset that excess demand. They issue enough new GLD shares to supply that differential demand, and then use the proceeds to buy physical gold bullion that is held in trust for shareholders. Thus GLD is effectively a capital pipeline directly linking the vast pools of stock-market capital to gold. Differential buying pressure on GLD shares is quickly equalized into the underlying global physical gold market. So the more capital stock investors and speculators choose to deploy into GLD shares, the faster the gold price rises. GLD shunts stock-market capital into and out of gold, a double-edged sword. When stock traders sell GLD shares faster than gold itself is being sold, this ETF’s price will decouple to the downside. GLD’s custodians must quickly absorb that excess share supply, so they buy back enough shares to maintain gold tracking. They raise the capital necessary to make these purchases by selling some of the physical gold bullion held in trust for shareholders. Stock capital sloshes back out of gold. Even though the world’s gold miners launched this flagship gold ETF via their World Gold Council to increase gold investment demand, conspiracy theorists have long attacked it. So GLD has always been super-transparent. Every single day, it publishes its total gold-bullion holdings itemized down to the individual-gold-bar level including refiners, serial numbers, and weights. This week this list was 1,164 pages long! Watching GLD’s daily physical-gold-bullion holdings data is exceedingly important for all gold investors and speculators. It effectively shows stock-market capital flows into and out of gold itself. When GLD’s holdings are rising, stock-market capital is migrating into gold. When they are falling, it is exiting out. And this week an extraordinary reversal happened likely heralding a major sea change in gold investment. This first chart looks at GLD’s gold-bullion holdings over the past year or so in blue, measured in metric tons. They are superimposed over the gold price rendered in red. Stock investors and speculators just flooded back into gold through incredible differential GLD-share buying in recent days. I’ve carefully studied and watched GLD’s holdings for over a decade now, and I’m just amazed by this serious buying. Last Thursday January 15th, stock traders bought enough excess GLD shares to force its custodians to buy 9.6 tonnes of gold bullion. That grew GLD’s holdings by 1.4% that day, its biggest daily build since August 2011 just before the last major gold peak near $1,900! Stock investors flooded back into gold via GLD shares as gold soared 2.4% following Switzerland’s central bank greatly shocking the world’s markets. The Swiss National Bank suddenly and surprisingly abandoned its efforts to cap the Swiss franc in euro terms. This campaign was launched in September 2011 in response to the Eurozone financial crisis. It was intended to protect Switzerland’s export-heavy economy, keeping products affordable for its dominant Eurozone customers. SNB officials constantly called that cap the cornerstone of their bank’s policy. So traders weren’t ready for the SNB to capitulate out of the blue, it was a black-swan currency event sending shock waves cascading through global markets. Gold caught a major safe-haven bid in Europe on the resulting chaos, and American stock traders piled on. They were way underexposed to gold after years of shunning it, and their heavy differential buying of GLD shares certainly helped propel gold higher. Strong rallies feed on themselves, as nothing begets more buying like fast-rising prices. Stock traders snatched up GLD shares at such a furious pace that its holdings surged 13.7t or 1.9% on Friday the 16th and another 11.4t or 1.6% on Tuesday the 20th. All together over that 3-trading-day span, enough stock-market capital poured into gold via the GLD conduit to catapult this ETF’s holdings up 34.7t or 4.9%! This GLD holdings surge is readily evident above, a radical change from the heavy differential selling pressure GLD shares suffered in late 2014. I couldn’t remember the last time GLD’s holdings rocketed up so fast, so I had to crunch some numbers. This recent buying spree turns out to be GLD’s biggest 3-day build in both absolute and percentage terms in many years, a truly extraordinary buying event. GLD’s holdings hadn’t shot up by 34.7t in 3 trading days since May 2010, 4.7 years ago. That was an interesting time as stock traders migrating back into gold via GLD would help drive the yellow metal a whopping 56.3% higher over the next 15 months. Major stock-market capital returning to gold was a very bullish omen . This was also true the last time GLD saw a 4.9% 3-day percentage build in February 2009. That was 5.9 years ago, right after that once-in-a-century stock panic in late 2008 sucked in gold due to the resulting record U.S. dollar rally . But the subsequent big GLD-share differential buying comparable to last week’s heralded the early months of a major new gold up-leg. Over the next 2.5 years the gold price would rocket 92.4% higher as investors returned! So stock traders flooding into GLD is a major buy signal . As of this Wednesday, the data cutoff for this essay, GLD’s holdings were up 31.4 metric tons or 4.4% so far in January. This is serious buying by any standard. The chart above details GLD’s absolute and percentage holdings builds and draws on a monthly basis since early 2013. And the previous best month over this past year is merely July’s 11.1t or 1.4%. GLD’s January-to-date build nearly triples that! Though I was a few months early thanks to the Fed’s extreme financial-market distortions, I had been expecting stock investors to start returning to gold via GLD in a major way. They had totally abandoned gold in 2013 and 2014 as the Fed’s third quantitative-easing debt-monetization campaign had artificially levitated the stock markets. With stocks doing nothing but rally, demand for alternative investments collapsed. But stock markets are forever cyclical and can’t climb forever, no matter how much paper money the world’s central banks choose to print. So stretched to lofty and very-overvalued levels, it was only a matter of time until they inevitably reversed. And once that got underway, investors would remember the ancient wisdom of prudent portfolio diversification and start rebuilding their extraordinarily-low gold exposure. GLD’s holdings slumped to a miserable 6.3-year low of 704.8t earlier this month. At the prevailing gold price of $1,213, they were worth about $27.5b. Meanwhile, the 500 elite stocks of the S&P 500 had a collective market capitalization near $18,881.7b. Stock investors’ gold exposure can be approximated by comparing their capital invested in GLD shares to their capital invested in the leading S&P 500 stocks. That equates to mainstream stock-investor exposure to gold via GLD of just 0.15%! That is incredibly low by all historical standards. Many of the world’s best battle-hardened investment advisors believe that every investor should always have 5% to 10% of their capital deployed in gold. This is a prudent portfolio-diversifying hedge, an insurance policy that will pay out big when the stock markets decisively roll over. Merely to hit 5%, stock investors would have to up their GLD holdings by a staggering 34.3x! That’s not going to happen, but it illustrates just how chronically underinvested in gold stock investors are today. There is a more conservative read on at least how much stock capital will almost certainly flow back into GLD over the next couple years or so. This comes from just a few years ago when gold’s price last peaked. Back in August 2011 gold surged to $1,894 the last time it was in favor. That was inarguably the time gold enjoyed the most popularity among mainstream investors during GLD’s lifespan. That day GLD’s gold bullion held in trust for its shareholders was worth $78.2b, or 2.8x higher than today’s levels. But with the S&P 500’s market cap only at $10,585.3b then, stock investors’ gold exposure was around 0.74%. While that was a far cry from a basic 5% portfolio allocation in gold, it was still 5.1x higher than stock investors’ gold exposure today. So it’s not a stretch at all to expect stock investors’ gold exposure to gradually return to those gold-in-favor levels in the coming years. Gold will slowly regain popularity as these Fed-goosed stock markets inevitably roll over and lapse into their overdue cyclical bear market. Stock investors will remember the wisdom of prudent portfolio diversification to protect themselves from stock downturns. And no alternative investment is better for this critical mission than gold, thanks to its strong inverse correlation to the general stock markets. The recent serious differential GLD-share buying by stock investors is likely only the start, as they remain chronically underinvested in the yellow metal. This last chart illustrates how much differential GLD buying is still left to go. It extends GLD’s holdings and the gold price back to early 2013, when the Fed’s QE3 campaign and associated jawboning started levitating the U.S. stock markets. As alternative investments fell out of favor, the differential selling that hammered GLD shares was epic. The quarterly draws and builds in GLD’s holdings are shown here. This past week’s serious differential GLD-share buying by stock investors was a radical change, even at this scale. But GLD’s holdings have a long ways left to go to mean revert out of recent years’ extreme selling. Interestingly just days before the Fed more than doubled QE3’s debt monetizations to include U.S. Treasuries in December 2012, GLD’s holdings were at an all-time record high of 1353.3 metric tons. And that certainly wasn’t some anomalous extreme. Back 2.4 years earlier in the summer of 2010, they had hit 1320.4t. They averaged 1238.2t in 2011 and 1294.2t in 2012, and gold was actually suffering a major correction and consolidation throughout most of that span so it certainly wasn’t in favor among investors. So there’s no reason at all not to expect GLD’s holdings to fully mean revert back to those levels. Even after this week’s stunning surge of stock-market capital flowing into gold via GLD shares, this ETF’s holdings still have to climb another 553.8t to regain 2012’s average levels. That’s a staggering amount of marginal gold investment demand, and if it happens within a year or two it will help catapult the gold price dramatically higher. 2013’s epic outlying record plunge in GLD’s holdings puts this into perspective. That year as the Fed seduced stock investors into abandoning portfolio diversification, GLD’s holdings plummeted 552.6t. Nearly half of this extreme selling happened in 2013’s second quarter, which saw gold’s worst quarterly loss in an astounding 93 years! Those massive GLD gold-bullion liquidations that year driven by extreme differential selling helped batter gold down 27.9% in 2013. Imagine that all reversing. If stock investors merely migrate enough capital back into gold through the GLD conduit to regain those 2012 average GLD-holdings levels, gold is going far higher. Its price actually averaged $1,669 that year before 2013’s extreme selling. And with 2012’s correcting and consolidating, those gold levels were certainly nothing special and this metal wasn’t popular among investors. Such levels should easily return. Financial markets are forever cyclical , no trend lasts forever. No matter what money-printing mischief central banks are up to, stock bulls aren’t perpetual. They always eventually yield to subsequent bears. And just as stock markets can’t rise forever, gold can’t fall forever. Major reversals are afoot in both the lofty euphoric stock markets and depressed loathed gold market. Stock investors diversifying will lead the way. Their major GLD differential buying that is coming to help protect their portfolios will greatly accelerate gold’s young new up-leg. And gold’s gains will entice even more stock investors to participate by moving some of their own capital into GLD shares. This process will not only be self-feeding among the stock investors, but it will spawn major new buying in the crucial American gold-futures market as well. It wasn’t just American stock investors fleeing GLD shares that were responsible for 2013’s extreme gold downside anomaly, but American speculators aggressively dumping gold futures. And even though these guys recently reached selling exhaustion and started buying, they have a massive amount left to go to restore their total long and short gold-futures contracts to their normal years’ averages between 2009 to 2012. Stock investors buying GLD shares and futures speculators adding longs and covering shorts will work together to amplify gold’s coming upside. And the longer, faster, and higher gold rallies, the more it will motivate more investors to deploy capital to participate. This week’s incredible differential GLD-share buying is only the earliest vanguard of a major reversal getting underway in gold, it’s very exciting. Investors and speculators can certainly play gold’s big mean reversion higher in GLD shares, that’s the most-efficient and least-risky way. But since GLD’s mission is to mirror the gold price less this ETF’s annual 0.4% management fee, gold’s gains are the best GLD will see. Meanwhile the stocks of the gold miners, which were recently trading at fundamentally-absurd levels, will greatly leverage gold’s gains. The bottom line is American stock traders started pouring capital back into gold this week in a serious way. They bought GLD shares so aggressively that this ETF had to shunt enough stock capital into physical gold bullion to grow its holdings by their fastest pace in about 5 years. And this is likely just the beginning, as American stock investors remain woefully underinvested in gold and not prudently diversified. As the lofty overvalued U.S. stock markets inevitably roll over without Fed money printing forcing them higher any more, gold will gradually return to favor. Stock investors have vast GLD buying left to do to attain even a semblance of portfolio diversification. This massive buying is going to propel today’s low gold prices far higher, earning fortunes for contrarians brave enough to buy in early ahead of the herd. Copyright 2000-2015 Zeal LLC ( ZealLLC.com ) Additional disclosure: I am long extensive gold-stock positions which have been recommended to our newsletter subscribers.