Tag Archives: lists

NYSE Margin Debt Dips A Mite In December: Risk Rank At No. 43

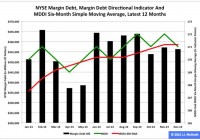
Summary New York Stock Exchange margin debt slipped slightly to $456.28 billion in December from $457.11 billion in November. On the same basis, the SPDR S&P 500 Trust ETF’s adjusted closing monthly share price also slipped slightly to $205.54 from $206.06. The risk of speculation appeared lower in December than it did in November, but higher than it did in 69.93 percent of all months ranked by my methodology. New York Stock Exchange margin debt and the SPDR S&P 500 Trust ETF (NYSEARCA: SPY ) moved in the same direction in December for the second straight month, as each was down a wee bit. The level of NYSE margin debt relinquished -$823 million, or -0.18 percent, and the share price of SPY surrendered -$0.52, or -0.25 percent. Many equity market participants consider margin debt a long-term indicator of speculation in the stock market because of their tendency to move either higher or lower together. The NYSE has reported monthly data on securities market credit in three discrete series since 2003 and on margin debt itself since 1959. My primary analyses of these three data series focus on two proprietary metrics, the Margin Debt Directional Indicator, or MDDI, and the Securities Market Credit Risk Rank , or SMC Risk Rank, as described in “NYSE Margin Debt As An Indicator Of Long-Term Movements In S&P 500.” Figure 1: MDDI, January 2014-December 2014 (click to enlarge) Source: This chart is based on a proprietary analysis of monthly margin-debt data at NYSE’s online site. NYSE margin debt in December was -$9.44 billion, or -2.03 percent, lower than it was at its all-time high level in February (Figure 1). The anomalous behavior of margin debt in neither falling a great deal nor rising a great deal during the rest of 2014 appears unsustainable, factoring in the U.S. Federal Reserve’s actual announcement of the end of its latest quantitative easing program Oct. 29 and projected announcement of the beginning of its newest interest rate cycle April 29. This anomalous behavior is reflected by the MDDI, which basically is a comparative assessment of NYSE margin debt in the two most recent months of the data series. If the latest value of the MDDI ( MDDI in the above figure) is higher than its six-month simple moving average ( MDDI 6M SMA in the same figure), then I consider the market to be in bullish mode. If the most recent value of the MDDI is lower than its six-month SMA, then I consider the market to be in bearish mode. The MDDI’s December level is 171, which is lower than its November value of 172 and its six-month SMA of 171.17. As a result, I consider the equity market to have switched modes as of Dec. 31, to bearish from bullish. Based on the January performances of the stock market in general and SPY in particular, I anticipate a continuation of this mode for another month (at least). Figure 2: Highest And Lowest Risk Months, Per SMC Risk Rank (click to enlarge) Source: This table is based on proprietary analyses of monthly securities-market-credit data at NYSE’s online site. December is No. 43 among all 143 months evaluated since the January 2003 baseline by my SMC Risk Rank methodology, which carries out a comparative assessment of the data NYSE has reported in three discrete series: Margin Debt , Free Credit Cash Accounts and Credit Balances in Margin Accounts . The dynamic SMC Risk Rank is designed as a measure of equity market risk associated with speculation, ranking each month in the data set on an ongoing basis. At present, June 2014 is No. 1 , February 2014 is No. 2 and December 2013 is No. 3 among all months ranked (Figure 2). November’s SMC Risk Rank of No. 43 means I consider the stock market risk associated with speculation last month was higher than 69.93 percent and lower than 29.73 percent of all other months evaluated by the methodology. A high SMC Risk Rank for a given month indicates the market may be close to a significant peak, and a low SMC Risk Rank for a given month suggests the market may be close to a significant trough. In my interpretation, the term close in this context typically has meant within three to six months . Figure 3: NYSE Margin Debt And SPY, January 1993-December 2014 (click to enlarge) Source: This chart is based on monthly margin debt data at NYSE’s online site and adjusted closing monthly share prices of SPY at Yahoo Finance . Historically, NYSE margin debt and SPY have tended to move together, with an almost perfect positive correlation coefficient of 0.97 between them since the exchange-traded fund began trading in 1993 (Figure 3). I anticipate this close relationship will become increasingly important in the absence of Federal Reserve asset purchases under a QE program. If I were a party to either side of a margin debt transaction, then this is the time when I would start wondering whether more speculation is the wisest way to go. Disclaimer: The opinions expressed herein by the author do not constitute an investment recommendation, and they are unsuitable for employment in the making of investment decisions. The opinions expressed herein address only certain aspects of potential investment in any securities and cannot substitute for comprehensive investment analysis. The opinions expressed herein are based on an incomplete set of information, illustrative in nature, and limited in scope. In addition, the opinions expressed herein reflect the author’s best judgment as of the date of publication, and they are subject to change without notice. Disclosure: The author has no positions in any stocks mentioned, and no plans to initiate any positions within the next 72 hours. (More…) The author wrote this article themselves, and it expresses their own opinions. The author is not receiving compensation for it (other than from Seeking Alpha). The author has no business relationship with any company whose stock is mentioned in this article.

Can Energy ETFs Regain Fervor On Capital Spending Cuts?

After a seven-month wild run, oil and energy stocks have bounced back strongly in recent sessions following the slew of capital spending cuts by several major players in the industry. This move, along with the latest data that a number of U.S. oil drilling rigs fell the most in 30 years last week, propelled the oil prices higher. In fact, both the crude and Brent surged about 20% in the four days till Tuesday, marking the longest winning streak since January 2009. However, oil price again reversed its four-session rally, dropping 8.7% yesterday after U.S. crude inventories jumped to a record high last week. Notably, crude is currently hovering around $50 per barrel while Brent is trading at over $55 per barrel. Spending Cuts at a Glance A large number of firms whether domestic or international have slashed their capital spending for this year in order to conserve cash balance for dividend payments. The second largest U.S. oil giant Chevron (NYSE: CVX ) trimmed its capital spending by 13% to $35 billion for this year while ConocoPhillips (NYSE: COP ) cut its spending by an additional 15% after reducing it 20% in December. Occidental Petroleum (NYSE: OXY ) reduced its capital spending by 33% to $5.8 billion for this year. European oil majors also followed suit. BP plc (NYSE: BP ) announced spending cuts by 20% to $20 billion for this year from the previous guidance of $25 billion. Royal Dutch Shell (NYSE: RDS.A ) plans to cut capital spending by $15 billion over the next three years while Total SA (NYSE: TOT ) trimmed its capital expenditure by 10% for this year. Further, the Chinese oil major CNOOC (NYSE: CEO ) slashed its capital spending by as much as 35% for this year and Russian oil major Gazprom ( OTCQX:GZPFY ) reduced it by $8 billion. Brazilian state-run energy giant Petroleo Brasileiro S.A. (NYSE: PBR ) or Petrobras also lowered its capital expenditure budget to $31-$33 billion from $44 billion. The efforts taken by these oil giants will likely curb oil production and reduce global supply, and thereby lead to higher oil prices. Market Impact Driven by a slew of investment cut plans, energy stocks and ETFs have made an impressive comeback and are easily crushing the overall market by wide margins over the past five days. In particular, SPDR S&P Oil & Gas Exploration & Production ETF (NYSEARCA: XOP ) , First Trust ISE-Revere Natural Gas Index Fund (NYSEARCA: FCG ) and PowerShares S&P SmallCap Energy Fund (NASDAQ: PSCE ) gained the most surging in double digits in the same period. Below we profile these ETFs in detail and discuss some of the specifics behind their recent rally: XOP This fund provides equal weight exposure to 83 firms by tracking the S&P Oil & Gas Exploration & Production Select Industry Index. Each holding makes up for less than 2.2% of the total assets. XOP is one of the largest and popular funds in the energy space with AUM of $1.9 billion and expense ratio of 0.35%. It trades in heavy volume of more than 10.4 million shares a day on average. FCG This fund offers exposure to the U.S. stocks that derive a substantial portion of their revenues from the exploration and production of natural gas. It follows the ISE-REVERE Natural Gas Index and holds 28 stocks in its basket that are well spread out across each component with none holding more than 6.05% of the assets. The fund has amassed $272.7 million in its asset base while charging 60 bps in annual fees. Volume is good with more than 942,000 shares exchanged per day on average. PSCE This fund provides exposure to the energy sector of the U.S. small cap segment by tracking the S&P Small Cap 600 Capped Energy Index. Holding 35 securities in its basket, it is concentrated on the top five firms that make up for 37.9% share. Other firms hold less than 5.4% of total assets. The fund is less popular and less liquid with AUM of $28.6 million and average daily volume of about 24,000 shares. Expense ratio came in at 0.29%. Other energy ETFs were also in deep green over the past five trading sessions. Some of these include IQ Global Oil Small Cap ETF (NYSEARCA: IOIL ) , First Trust Energy AlphaDEX (NYSEARCA: FXN ) , Market Vectors Unconventional Oil & Gas ETF (NYSEARCA: FRAK ) and PowerShares Dynamic Energy Exploration & Production ETF (NYSEARCA: PXE ) . All these are up in upper single digits. What’s In Store? The rally in the energy ETFs seems to be short lived as reduced investments will likely cut supply in the long term and short-term supply with remain intact. As per the latest EIA report, the U.S. crude stockpiles rose 6.3 million barrels in the week (ended January 30), much higher than the market expectation of a 3.7 million barrel increase. Total inventory came to 413.1 million barrels, representing the highest level in at least 80 years. The current threat facing the U.S. oil industry is the strike in the U.S. at nine refineries by the United Steelworkers union. This is the biggest strike since 1980 and will likely curtail crude processing adding to the supply glut. It could affect 10% of the U.S. refining capacity and if the strike turns to be a full-blown crisis, it could threaten about two-thirds of the total refining capacity, indicating more pain for the commodity and the energy stocks.

Is Cheap Oil Driving Transport Earnings And ETFs?

Transportation stocks have been the biggest beneficiaries of cheaper oil and an improving U.S. economy. This is easily reflected in their Q4 results as total earnings from 72.8% of the sector’s total market capitalization reported so far are up 20.6% on 5.5% revenue growth. Earnings surprises were impressive with 72.8% of the companies beating earnings estimates with a median surprise of 3.3 and 57.1% beating revenues with a median surprise of 0.4. In particular, earnings from several big players in the space like Union Pacific (NYSE: UNP ), Kansas City Southern (NYSE: KSU ), CSX Corp. (NYSE: CSX ), Delta Air Lines (NYSE: DAL ) and United Continental (NYSE: UAL ) have been encouraging. However, sluggish outlook from the bellwether United Parcel Service (NYSE: UPS ) had severely affected the broad space, erasing most of the stock gains made in the year. Transportation Earnings in Focus Earnings at the world’s largest package delivery company – UPS – were on par with the Zacks Consensus Estimate of $1.25 while revenues of $15.9 billion were marginally ahead of our estimate of $15.8 billion. The company projects earnings per share of $5.05-$5.30 for fiscal 2015, representing 6-12% growth on an annual basis. The mid-point is above the Zacks Consensus Estimate of $5.14. Further, the company reaffirmed its long-term earnings per share growth target of 9-13%. The share price of UPS grew about 0.4% on the day of its earnings release on February 2. The two largest U.S. airlines – DAL and UAL – flew higher after beating the Zacks Consensus Estimate on the earnings front. Both stocks surged 11.4% and 7.7% to touch new 52-week highs of $51.06 and $74.52, respectively, before being hit by UPS’ warnings. DAL is just up 0.4% to date since its earnings release on January 20 and UAL is down 1.8% following its earnings release on January 22. Earnings at Delta beat the Zacks Consensus Estimate by three cents while revenues of $9.65 billion edged past our estimate of $9.59 billion. On the other hand, earnings at United Continental came in at $1.20, outpacing our estimate by six cents, and revenues were $9.3 billion, on par with our estimate. UNP , the U.S. largest railroad, reported earnings of $1.61 per share, 10 cents ahead of the Zacks Consensus Estimate and 27% higher than the year-ago earnings. Revenues climbed 9% year over year to $6.2 billion, ahead of our estimate of $6.1 billion. The stock climbed 6.4% since its earnings announcement on January 22 before the market opened. Other major railroads like CSX and KSU have given mixed performances. While earnings at CSX meets our estimate of 49 cents, revenue of $3.19 billion exceed the Zacks Consensus Estimate of $3.18 billion. On the other hand, KSU earnings outpaced by 4 cents and revenues of $643 million lagged the Zacks Consensus Estimate of $658 million. Shares of CSX gained 3.3% to date post earnings on January 13 after the closing bell and KSU added nearly 1% since its earnings announcement on January 23 before the market opened. ETFs in Focus Given that the cheap fuel will continue to provide a big boost to transport earnings growth, investors should definitely tap the current beaten down prices in the form of ETFs with a lower level of risk. This is especially true as the transport sector actually has the best rank for any industry at the time of writing – about three-fourths of the industries under transport have Zacks Ranks in the top 37%, suggesting bullishness in the sector. iShares Dow Jones Transportation Average Fund (NYSEARCA: IYT ) The ETF tracks the Dow Jones Transportation Average Index, giving investors exposure to the small basket of 20 securities. The fund has a certain tilt toward large cap stocks at 49% while mid and small caps account for 31% and 19% share, respectively, in the basket. The product is heavily concentrated on the top five holdings, accounting for 42.8% of assets. From a sector perspective, railroad takes the top spot with less than half share in the basket, while air freight & logistics and airlines round off to the top three with double-digit exposure each. The fund has accumulated nearly $2 billion in AUM while sees good trading volume of around 490,000 shares a day. It charges 43 bps in annual fees and has lost 2.6% so far in the year. SPDR S&P Transportation ETF (NYSEARCA: XTN ) This fund uses the equal weight methodology to each security by tracking the S&P Transportation Select Industry Index. Holding 50 stocks in its basket with AUM of $623.4 million, each security accounts for less than 3.3% of total assets. The ETF is skewed toward small caps at 51% while mid and large caps account for 27% and 22% share, respectively. About one-third of the portfolio is dominated by trucking while airlines take another one-fourth share. Airfreight & logistics, and railroads also make up for a double-digit allocation. The fund charges 35 bps in fees per year from investors and trades in a moderate volume of more than 82,000 shares a day. XTN is down about 5.8% in the year-to-date timeframe. Bottom Line Investors should keep in mind that cheap fuel is currently a huge boon to the transportation sector. Better job conditions and an improving economy are also driving the growth in the sector. As a result, investors shouldn’t miss this opportunity to stuff these funds into their portfolio. Further, these funds could easily counter shocks from some of the industry’s biggest components like the recent UPS warnings.