Tag Archives: lists

Will The FOMC Bring Back Up GLD?

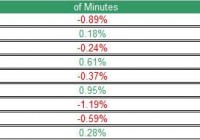
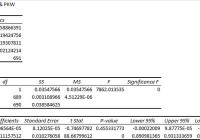
Summary The minutes of the last FOMC meeting were released. The minutes could indicate that the FOMC members have concerns that could postpone the next rate, which could bring back up GLD. The uncertainty in Europe around the Greek debt problem could play in favor of GLD. Since the beginning of the month, shares of the SPDR Gold Trust ETF (NYSEARCA: GLD ) fell by 5.8%. But the recent release of the minutes of the last FOMC meeting and the latest developments in Europe could provide some backwind for the gold ETF. The FOMC minutes revealed that its members wanted to reiterate the importance of remaining patient towards the next rate hike: “Many participants regarded dropping the “patient” language in the statement, whenever that might occur, as risking a shift in market expectations for the beginning of policy firming toward an unduly narrow range of dates. As a result, some expressed the concern that financial markets might overreact, resulting in undesirably tight financial conditions.” This is another indication that even though many of the FOMC members may consider raising rates in the coming months, they still don’t want to commit to a time frame and wish to trend very lightly when it comes to changing their policy. The reaction of GLD, however, was subtle, as prices slightly came up yesterday. Source of data taken from FOMC’s website and Google Finance The minutes also revealed that the FOMC members consider the global economic developments as one of the factors that could determine the Fed’s next move: “The Committee further decided that the postmeeting statement should explicitly acknowledge the role of international developments as one of the factors influencing the Committee’s assessment of progress toward its objectives of maximum employment and 2 percent inflation.” Perhaps the latest problems in Europe and the economic slowdown in other leading countries are starting to shift FOMC members’ opinion towards keeping rates low for a bit longer. Next week, Fed Chair Yellen is expected to testify before Congress; this testimony could provide additional input into what’s next for the Fed and whether there is a chance of a delay in the expected rate hike this summer. The ongoing problems in Europe, mainly the debt problems of Greece, could play in favor for precious metals investments such as GLD. The recent news is that Greece is still scrambling towards reducing some of the austerity measures that were agreed in the past, including reducing the budget surplus from 4.5% to 1.5% of its GDP. Some estimate that Greece could run out of cash by March. Moreover, Greek banks have been losing €2 billion in deposits per week, which will only put more pressure on the recently-elected Syriza government to reach an agreement with the EU. These developments are also likely to pressure down the euro against the U.S. dollar. Stronger dollar The recovery in the U.S. dollar has slowed down in the past few weeks, but the U.S. dollar could see additional gains in the coming months, especially if global economic slowdown persists. Further, as other central banks cut down rates (Bank of Canada and RBA) and implement QE programs (ECB and BOJ); these changes are likely to keep the U.S. dollar stronger. FOMC members voiced their concern over a stronger U.S. dollar: “…the increase in the foreign exchange value of the dollar was expected to be a persistent source of restraint on U.S. net exports, and a few participants pointed to the risk that the dollar could appreciate further.” (click to enlarge) Source of data taken from FRED Even though the recovery of the U.S. dollar at the beginning of the year coincided with the rise of GLD, the linear correlation between the two data sets was still strong and negative at the beginning of the year. Source of data taken from FRED This is only an indication that if the U.S. dollar were to resume its rally, this could have an adverse impact on the price of GLD. For now, the problems in Europe and the economic slowdown in China, which is another concern FOMC members reiterated in the last minutes, could still bring down the U.S. treasury yields. U.S. treasury yields, as I pointed out in the past, tend to have a negative relation with the price of GLD. Nonetheless, yields have gone up in the past several weeks, as the market increased the odds of the FOMC raising its cash rate in the coming months. Therefore, we still have sort of a stalemate when it comes to GLD: Higher uncertainty in Europe, weaker growth in China, and falling prices, which are likely to reduce the odds of the rate hike this summer, are keeping the demand for GLD up. Conversely, the ongoing rise in U.S. treasury yields, stronger U.S. dollar, and the slow recovery in the U.S. economy, partly due to low oil prices, are pressuring down GLD prices. Who will eventually win this stalemate? It’s hard to say at this point. So far, GLD hasn’t done much in the past year, and until the FOMC makes its next move, GLD isn’t likely to budge a whole lot from its current level. We could see some short-term gains, especially as the uncertainty around Greece further unfolds, and if the FOMC continues to voice its concerns over the global economy. For more see: 3 Questions About Gold Disclosure: The author has no positions in any stocks mentioned, and no plans to initiate any positions within the next 72 hours. (More…) The author wrote this article themselves, and it expresses their own opinions. The author is not receiving compensation for it (other than from Seeking Alpha). The author has no business relationship with any company whose stock is mentioned in this article.

This New ETF Looks To Take Advantage Of The Stock Buyback Trend

Summary State Street launched the SPDR S&P 500 Buyback ETF with the intention of capitalizing on the recent share buyback popularity. Its closest comparable, the PowerShares Buyback Achievers ETF, has doubled the return of the S&P 500 since its inception in 2006. Roughly 80% of S&P 500 companies have bought back their own shares within the last couple years. Companies, it seems, have had an insatiable appetite for buying back their own shares lately. It’s a strategy that is a bit of a double-edged sword. It’s great for shareholders as a reduced share count boosts earnings per share and almost always pops the share price. It also works out better for taxes because it’s essentially a tax-free transaction (as opposed to dividends which would be taxable). On the other hand, it could be an indication that the company doesn’t necessarily have any higher returning projects to invest in and instead are choosing to return the excess capital to shareholders. Big names like Boeing (NYSE: BA ), Microsoft (NASDAQ: MSFT ) and Apple (NASDAQ: AAPL ) have been big purchasers of their own stock lately and it’s estimated that 80% or more of S&P 500 companies have bought back their own shares recently. Given the effects that it has on stock prices, it’s not surprising that an ETF is attempting to jump on the trend in an attempt to deliver oversized returns. Earlier this month, State Street launched the SPDR S&P 500 Buyback ETF (NYSEARCA: SPYB ). The goal of the ETF is simple. It looks to invest in the top 100 stocks with the highest buyback ratios in the S&P 500 over the last 12 months. Current top holdings include big names like Southwest Airlines (NYSE: LUV ), Yahoo (NASDAQ: YHOO ) and Dollar Tree (NASDAQ: DLTR ). The fund’s 0.35% annual expense ratio is not unreasonable as it falls in line with the expense ratios of many of State Street’s SPDR ETFs, but is a little on the high side considering the fact that it is passively benchmarked to the S&P 500 Buyback Index. While the concept of this ETF will be of interest to many investors, I can’t help thinking that this type of ETF has been done and with much success already. The PowerShares Buyback Achievers ETF (NYSEARCA: PKW ) was launched back at the end of 2006, and since then has returned a total of 92% compared to the S&P 500’s return of 44%. In just the past five years, the Buyback Achievers ETF has returned 142% compared to the S&P 500’s 93%. Perhaps the key differentiator between the two ETFs is the expense ratio. The SPDR S&P 500 Buyback ETF charges roughly half of the 0.71% expense ratio that the PowerShares ETF charges. Management styles are slightly different – the SPDR ETF is equally weighted whereas the PowerShares ETF is not – but the concept is substantially the same. Liquidity is also a big factor currently. The PowerShares ETF manages roughly $2.7B and trades around 380K shares a day. The SPDR ETF is obviously brand new and has just $5M under management with very thin trading volume. Conclusion Given the popularity of stock buybacks in the last 1-2 years, it’s not surprising to see State Street begin offering a product designed to capture the performance boost that typically comes with them. PowerShares has already proven that this strategy can produce above average returns over a lengthy period of time. While State Street has demonstrated a great deal of success over time with its SPDR family of ETFs, I feel that investors looking to jump on the buyback bandwagon might be better served starting with the PowerShares Buyback ETF first. First, what’s the harm in going with the product with the proven track record. Second, give the SPDR Buyback ETF time to build an asset and trading base so it can shake out some of its operating inefficiencies first. Overall, I think the SPDR S&P 500 Buyback ETF will ultimately be a solid addition to the State Street lineup and warrants investor consideration. Disclosure: The author is long AAPL. (More…) The author wrote this article themselves, and it expresses their own opinions. The author is not receiving compensation for it (other than from Seeking Alpha). The author has no business relationship with any company whose stock is mentioned in this article.

PKW Shouldn’t Be Able To Outperform SPY Reliably, But It Did

Summary I’m taking a look at PKW as a candidate for inclusion in my ETF portfolio. The risk level is reasonable and the correlation is high. The performance is surprisingly good. The liquidity is solid, so I expect the statistics to be reliable. Despite the higher expense ratio, the ETF has stacked up very well to SPY over the last several years. Investors should be seeking to improve their risk adjusted returns. I’m a big fan of using ETFs to achieve the risk adjusted returns relative to the portfolios that a normal investor can generate for themselves after trading costs. I’m working on building a new portfolio and I’m going to be analyzing several of the ETFs that I am considering for my personal portfolio. One of the funds that I’m considering is the PowerShares Buyback Achievers Portfolio (NYSEARCA: PKW ). I’ll be performing a substantial portion of my analysis along the lines of modern portfolio theory, so my goal is to find ways to minimize costs while achieving diversification to reduce my risk level. What does PKW do? PKW attempts to track the total return (before fees and expenses) of NASDAQ Buyback Achievers® Index. At least 90% of the assets are invested in funds included in this index. PKW falls under the category of “Large Blend”. Does PKW provide diversification benefits to a portfolio? Each investor may hold a different portfolio, but I use (NYSEARCA: SPY ) as the basis for my analysis. I believe SPY, or another large cap U.S. fund with similar properties, represents the reasonable first step for many investors designing an ETF portfolio. Therefore, I start my diversification analysis by seeing how it works with SPY. I start with an ANOVA table: (click to enlarge) The correlation is just under 96%. That’s a very high level of correlation and relatively unattractive for investors hoping for diversification benefits. As an investor using modern portfolio theory, I would prefer to see lower levels of correlation. Of course, the low value correlation wouldn’t mean much if the values were being distorted by poor liquidity. The average volume of nearly 500,000 shares per day suggests that liquidity shouldn’t be a concern. That’s a good sign for investors wanting verification of the statistics or wanting to know that they can exit the position with less concern about it deviating from NAV. Standard deviation of daily returns (dividend adjusted, measured since November 2013) The standard deviation is fairly reasonable. For PKW, it is .787%. For SPY, it is 0.748% for the same period. The ETF is definitely showing a little more volatility than SPY when we compare returns on a daily basis. Mixing it with SPY I frequently run comparisons on the standard deviation of daily returns for the portfolio, assuming that the portfolio is combined with the S&P 500. However, for PKW, I don’t think that adds much value. The correlation being nearly 96% really destroys the benefits of diversification. Why I use standard deviation of daily returns I don’t believe historical returns have predictive power for future returns, but I do believe historical values for standard deviations of returns relative to other ETFs have some predictive power on future risks and correlations. Yield and Taxes The distribution yield is 1.06%. I like to see strong yields for retiring portfolios, because I don’t want to touch the principal. By investing in ETFs I’m removing some of the human emotions, such as panic. Higher yields imply lower growth rates (without reinvestment) over the long term, but that is an acceptable trade off in my opinion. This ETF doesn’t have a high yield, but I am far enough away from retirement to be willing to work with the weaker yields. Expense Ratio The ETF is posting an expense ratio of .68%. That’s high compared to most of the ETFs that are appealing to me, but the expense ratio may reflect the premium being charged for the trading methodology the ETF is using to determine the positions within the ETF. Market to NAV The ETF is at a .06% discount to NAV currently. Premiums or discounts to NAV can change very quickly, so investors should check prior to putting in an order. Generally speaking, that discount to NAV isn’t big enough to be a big deal. However, even a small discount to NAV is fairly attractive when we are talking about a high quality ETF. Largest Holdings The diversification in the holdings isn’t going to be a strong selling point. (click to enlarge) Conclusion PKW was one of the most difficult ETFs to make a decision about. The ETF posts a very high correlation to SPY and a high expense ratio. Some screeners don’t have a portfolio turnover ratio for the ETF, but the prospectus states that in the last fiscal year the turnover ratio was 92%. I expect that kind of turnover to require some costs, but I generally don’t want to pay higher turnover ratios because my use of ETFs involves relying on markets to be reasonably efficient. If the markets are thoroughly efficient, then creating a proprietary trading system to select which positions to enter and which ones to end should not result in any reliable excess returns. However, history is providing some support for the methodology PKW is using. I was suspicious about their outperformance of SPY in the test period, so I extended my sample to a five-year period and looked at the returns on a time line. The result is that PKW outperformed SPY meaningfully over that five-year period. Looking at the lines, it isn’t a single period where PKW outperformed either. The fund’s performance has been strong and steady, which makes it appear more repeatable. I wanted to eliminate the ETF for the high expense ratio and relative weakness in diversification, but I can’t do it. Maybe it is just chance that eventually an ETF had to deliver this kind of strong performance over an extended period, but I won’t toss out an ETF that makes a fairly impressive case for itself without digging deeper. Disclosure: The author has no positions in any stocks mentioned, and no plans to initiate any positions within the next 72 hours. (More…) The author wrote this article themselves, and it expresses their own opinions. The author is not receiving compensation for it (other than from Seeking Alpha). The author has no business relationship with any company whose stock is mentioned in this article. Additional disclosure: Information in this article represents the opinion of the analyst. All statements are represented as opinions, rather than facts, and should not be construed as advice to buy or sell a security. Ratings of “outperform” and “underperform” reflect the analyst’s estimation of a divergence between the market value for a security and the price that would be appropriate given the potential for risks and returns relative to other securities. The analyst does not know your particular objectives for returns or constraints upon investing. All investors are encouraged to do their own research before making any investment decision. Information is regularly obtained from Yahoo Finance, Google Finance, and SEC Database. If Yahoo, Google, or the SEC database contained faulty or old information it could be incorporated into my analysis. The analyst holds a diversified portfolio including mutual funds or index funds which may include a small long exposure to the stock.