Tag Archives: learn-more

Dominion Resources Set To Grow At Better Pace Than Its Peers

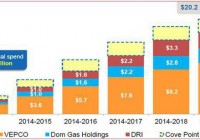
Summary Ongoing efforts to extend and improve operations will grow future top and bottom-line numbers. Company’s healthy earnings growth prospects will support cash flow base. D offers cheaper growth as compared to peers. Dominion Resources (NYSE: D ), one of the largest U.S. utility companies, has extended operations across the Mid-Atlantic region. D’s diversified electric and natural gas operations have been getting better revenue and earnings growth. As the company is increasing its growth capital expenditures to grow both electric and natural gas businesses, D’s long-term earnings growth outlook looks stable and attractive. And in fact, significant growth potential as a result of capital expenditures makes me believe the company will continue to grow its dividends at a healthy pace in the long term. The company’s earnings are expected to grow at an average rate of 6% in the next five years. Along with healthy growth prospects, the stock offers an attractive dividend yield of approximately 3%, which makes it an attractive pick for dividend-seeking investors. Elevated Growth Capital expenditure will guard D’s Long-Term Growth The U.S. utility sector has performed pretty well in 2014. And in the wake of improving economic conditions, future growth prospects of the industry also look bright. As far as D is concerned, with ongoing increases in its growth capital expenditures directed towards betterment and extension of its infrastructure and operations, the company has been strengthening its position among other utility sector giants. And in this regard, D has recently increased its long-term capital expenditure outlook from 2014-2019; the company will now spend $20.4 billion (guidance mid-point), higher than the previous forecast of $14 billion , on its various energy infrastructure projects. The value of these growth investments lies in strengthening the company’s current energy infrastructure in order to serve its customer base in a more competent and effective way. The following chart shows updated figures for the company’s increased capital expenditure on various growth projects. (click to enlarge) Source: Investor’s Meeting Presentation As natural gas production has significantly increased in the U.S., D is directing the major chunk of its capital expenditure to improve its natural gas infrastructure. As a matter of fact, one of the most important growth projects of the company is the Atlantic Coast Pipeline (NYSE: ACP ) project, which is a joint venture of D, Duke Energy (NYSE: DUK ), Piedmont Natural Gas Company (NYSE: PNY ) and AGL Resources Inc. (NYSE: GAS ). The ACP project’s pipelines, which have a capacity of 1.5Bcf/day, expandable to 2Bcf/Day, are waiting for FERC approval. The project’s construction is expected to begin in mid-2016, after which it will be made available for commercial operations by the end of 2018. D has the largest stake of 45% in the project, and I believe the company will benefit from this $5 billion project in the long run by meeting the increased natural gas transmission demand in Virginia and in North Carolina. Also, the company has invested $500 million towards its 1.0-1.5Bcf/day Supply Header Project (NYSE: SHP ). The timing to start SHP operations has been perfectly linked to the ACP project in order to support ACP by connecting its pipelines with five supply header reception points. With their operations scheduled to start in 2018, ACP and SHP will deliver natural gas to Virginia and North Carolina. In fact, these projects will allow D to increase its rates, which will portend well for its top and bottom-line growths in the long term. In addition to the ACP and SHP projects, the company has also agreed to acquire CGT for its subsidiary Dominion Midstream Partners, LP (NYSE: DM ). The addition of CGT offers an appealing opportunity to DM to raise rates in Virginia and Carolina, which will portend well to improve the company’s overall earnings base in the years ahead. Furthermore, the company is actively working to capitalize on the growth potentials of its Cove Point LNG export project, which has a capacity of 5.25 million tons/year . The Cove Point terminal facility is the first LNG export facility outside Louisiana and Texas to get government permission to export LNG. And it has created D’s monopoly, which will allow the company to enhance its bargaining power with suppliers. The company has already signed a 20-year LNG supply contract with Japan’s Sumitomo Corporation and Gail India. Owing to the longevity of these contracts, I believe D will have secure and strong top and bottom line bases for the years ahead. In addition to the abovementioned projects, the company is also making investments in renewable energy projects to strengthen its energy portfolio and comply with environmental regulations. In this regard, D has acquired the 28.4MW West Antelope Solar Park and the 50MW Pavant Solar Project . In its attempts to further capitalize on the growth prospects of renewable energy projects, the company has recently filed a request with VSCC to construct the first and largest solar facility in Virginia. By facilitating its customers to purchase electricity from its 2MW solar energy facility in Virginia, the company has created another important revenue generating source. Due to the impressive capital expenditure outlook and healthy growth prospects of the ongoing projects, I believe D is well-headed to delivering EPS growth in high-single digits. The company is scheduled for the 4Q’14 earnings call early next month, and during the earnings call, D will update its capital expenditure outlook and provide 2015 earnings guidance; any increase in capital expenditure outlook will portend well for its future growth and stock price. Hefty Dividends D’s healthy growth prospects have been fueling its earnings and cash flow growth, and helping it make attractive dividend payments to shareholders. Owing to its strong track record of making hefty dividend payments, the company is currently offering an attractive dividend yield of 3% . Since D is aggressively pursuing growth opportunities by making capital expenditures, I believe the company will attain more cash flow stability in the years ahead. Also, the company will continue to grow its dividends at a healthy pace in the years ahead; in the last five years, the company increased its dividends at an average rate of 7.3% . Risks The company’s efforts to expand its business operations, if not handled and executed effectively, could result in mismanagement and could weigh on its future performance. Moreover, regulatory restrictions and unfavorable movements in commodity prices are key risks to its future stock price performance. Conclusion The company’s ongoing efforts to extend and improve its operations are well-headed to grow its future top and bottom-line numbers. Moreover, the company’s healthy earnings growth prospects will support its cash flow base, which will allow it to consistently grow its dividends. The company currently has a higher forward P/E of 21.15x , as compared to Duke Energy’s and Southern’s forward P/E of 18.60x and 18.20x , respectively. I believe the higher forward P/E of D is justified due to its better growth prospects, as shown below in the table. Also, the company offers cheaper growth as compared to its peers, as it has a lower PEG of 2.9 , as compared to DUK’s PEG of 3.5 and SO’s PEG of 4.5 . The following table shows that D’s future earnings growth rate remains better than its peers. 2015 2016 2017 Long-Term 5-Year D 8.77% 4.80% 6.11% 6.05% DUK 3.97% 4.34% 5.27% 4.76% SO 2.13% 3.66% 4.31% 3.63% Source: Nasdaq.com

The SPDR S&P 600 Small Cap ETF: Let’s Analyze It Using Our Scorecard System

Summary Analysis of the components of the SPDR S&P 600 Small Cap ETF (SLY) using my Scorecard System. Specifically written to assist those Seeking Alpha readers who are using my free cash flow system. Compares the results of the SPDR S&P 600 Small Cap ETF to the SPDR S&P 500 ETF. Back in late December I introduced my free cash flow “Scorecard” system here on Seeking Alpha, through a series of articles that you can view by going to my SA profile . My purpose in doing so was to try and teach as many investors as I could, how to do this simple analysis on their own as I believe in the following: “Give a person a fish and you feed them for a day, Teach a person to fish and you feed them for life” I have been very pleased with the positive feedback that I have received so far, but included in that feedback were many requests by those using my system, to see if they did their analysis correctly or not. Since the rate of these requests have been increasing with every new article I write, I decided to concentrate my attention on articles analyzing indices and industry ETF’s covering a broad range of sectors. That way those of you using my system will have something like a “teacher’s edition” that will give you all the correct calculations for each component. Obviously I couldn’t include the financials used to create the results for all my ratios (as I would need to write you a book instead), so instead I will provide just my Scorecard results for each index or ETF and then let everyone go back and analyze each company and see if you get the same answers that I did. My data source will always be Y-Charts . I designed this system for the newbie investor, whom may have limited knowledge of investing, and assure them that with just a little effort, anyone can master the system I have presented here. As I write more articles, my hope in doing so is that everyone will be able to follow my work and then go investigate the stocks that seem interesting to them. Think of this project as sort of like the game show “JEOPARDY”, where I give you the final answers and then you go figure out the questions. Hopefully these articles can be used as reference guides that everyone can use over and over again, whenever the need arises. Again this analysis will just be my final Scorecard for the SPDR S&P 600 Small Cap ETF (NYSEARCA: SLY ) and for those new to this analysis, I suggest that you read my introductory Scorecard article on the SPDR S&P 500 ETF (NYSEARCA: SPY ) by going HERE . That article will send you HERE . There you will find the data on my “Free Cash Flow Yield” ratio which is one of three parts that I use it tabulating my final “Scorecard”. While free cash flow yield is a Wall Street ratio (Valuation Ratio), I also wrote an article that concentrated on my “CapFlow” and “FROIC” Ratios, which are Main Street ratios, which you can read about by going HERE . In this article I will generate my Scorecard results for each component and basically combine all three ratio results to generate one final result. Once completed, my Scorecard should give everyone a clearer understanding on how accurate the valuation is that Wall Street has assigned each company relative to its actual Main Street performance. Before we show you the final results of my Scorecard, here is brief introduction to how it works: Scorecard The Scorecard is the final score for any company under analysis and this is done by combining the three ratio (listed below) final results into one analysis, we grade each company with either a passing score of 1 or a failing score of 0 per ratio where a perfect final score per stock would be a 3. The ideal CapFlow results are anything less than 33%. The ideal FROIC score is any result above 20%. The ideal Free Cash Flow Yield is anything over 10%. So in analyzing Apple (NASDAQ: AAPL ) for example, we get for TTM (trailing twelve months). For the conservative investor: CAPFLOW = 16% PASSED FROIC = 34% PASSED FREE CASH FLOW YIELD = 7.6% FAILED SCORECARD SCORE = 2 (Out of possible 3) For the aggressive or “Buy & Hold” investor, we get a Scorecard score of 3 as Apple’s 7.6% free cash flow yield would be classified as a buy. These are the parameters for the Free Cash Flow Yield. It is important before preceding to determine what kind of investor you are as determined by the amount of risk you are willing to take. Then once you have done that, then pick the parameter list below that fits your risk tolerance. So without further ado here are the final Scorecard results for the components that make up the SPDR S&P 600 Small Cap ETF . What my Scorecard also achieves, besides telling you which individual stocks are attractive and which are not, is that it also allows you in “one shot” to see how overvalued or attractively valued the stock market is as a whole. For example, for the conservative investor now is the time to be extremely cautious as only these fifteen stocks came in with a perfect score of “3” As you can see I only found 15 bargains out of 600 for the conservative low risk investor and that comes out to just 2.5% of the total universe being bargains! As for the aggressive investor, who is willing to take on more risk, we have only 28 stocks that are considered higher risk bargains. That comes out to only 4.6% being attractive and 95.4% being holds or sells. So as you can see as a portfolio manager I have to work extremely hard just to find one needle in the haystack, while in March 2009 there were probably 300 bargains for the conservative investor at that time. Thus this data clearly shows that we are at the opposite extreme of where we were in 2009 and are in my opinion, at an extremely overvalued level. Here is the same analysis using the Dow Jones Index where I actually analyzed that index for 2001, 2009 and 2015. You can view those results by going HERE . In getting back to the main table above, the “TOTALS” you see at the end are the sum of each ratio divided by 600. The totals for both Scorecards are out of 1800 (1 point for each ratio result) as a perfect score were every stock would be a bargain. Therefore the conservative scorecard result is 374/1800 or 20.77% out of 100% and the more aggressive/buy & hold scorecard came in at 476/1800 or 26.44% out of 100%. The beauty of this system is that you can now compare this index result to any other index or ETF in juxtaposition. For example the S&P 500 Index for the conservative scorecard result is 384/1500 or 25.6% out of 100% and the more aggressive/buy & hold scorecard came in at 488/1500 or 32.5% out of 100%. Both clearly are not inspiring and could be a clear sign that the markets are ready for serious correction going forward. Always remember that the results shown above should not be considered investment advice, but just the results of the ratios. The system outlined in this article is just meant to be used as reference material to be included as just “one” part of everyone’s own due diligence. So in other words, don’t make investment decisions based on just my Scorecard results, but incorporate them as part of your own due diligence.

Risk Of Grexit And GLD

Background of the difficult economic conditions of the eurozone and the threat of Syriza’s victory in Greece. GLD has already priced in the threat of Syriza since November 2014 and has been rising steadily. Those who wants the safe habour of gold has already gone in. Risk of Syriza overtipping its hand for a quick fix to high debt with a primary budget surplus even though there are indications that Syriza will be moderate in power. Time to hold for those with GLD exposure and observe future developments and for those without exposure to initiate it. Difficult Times For The Eurozone Gold has been used been used as a medium of exchange since historic times and especially in times of turmoil. In modern times, with the creation of bank notes and the 1971 closing of the gold window, paper money is the medium of exchange and its power lies in the ‘full faith and credit of’ whichever government that is issuing the note. Now the full faith and credit of the United States Government is still valid in the market especially in a time where the U.S. economy is growing strongly (11 year high of 5% GDP growth in the third quarter of 2014), the U.S. Dollar (USD) is strong and most importantly the state of the union is strong. However the same attributes cannot be said for the eurozone. The eurozone economy is faltering at 0.2% growth for the same third quarter 2014 when the U.S. is growing strongly. The euro, as represented by the CurrencyShare Euro Trust ETF (NYSEARCA: FXE ), has declined by 23% since 05 May 2014 as seen in the chart below and this decline has accelerated since October 2014 which coincided with a dovish European Central Bank (ECB) decision. (click to enlarge) Lastly there is the issue regarding the state of the eurozone. The integrity of the eurozone had been tested in 2012 when Greece almost elected Syriza who came in second into government. This sparks the famous line by ECB President Draghi to ‘do whatever it takes’ to preserve the euro. The Rise and Threat of Syriza on Eurozone Now with the snap General Election on 25 January 2015, Syriza has defeated the previous government New Democracy to form the next government of Greece and its firebrand leader Alexis Tsipras would be youngest Greek Prime Minister at age 40 in 150 years. The whole reason that Syriza poses an existential threat to the whole eurozone project is quite simply because it does not want to pay its huge external debts. Its policy platform is anti-austerity, the repudiation of debt in essence and more social spending. This is what got it in power in the very first place which pleased the Greek population and at the same time send an earthquake to the rest of the eurozone. This whole political instability came about from the failed election of President of Greece. The President of Greece is a largely ceremonial role held currently by the incumbent Karolos Papoulias for 2 terms of 5 years each. His second term is set to end in March 2015. The President of Greece is elected by the Hellenic Parliament in Greece and has to be done latest 1 month before he is set to leave office as decreed by the Greek Constitution. The Prime Minister of Greece Samaras brought it forward to December 2014 but he was unable to secure a 2/3 majority of parliament vote for his candidate on the first 2 rounds of voting on the 17th and 23rd. The third round of voting on the 27th also failed to produce the reduced 3/5 majority of 180 votes which triggered the election for a new parliament on 25 January 2015. The new parliament will have to vote for the new president again by February 2015. Safe Harbor of GLD If you are a rich or middle class citizen (with enough money beyond the hand to mouth existence to be worried) in Europe and you are faced with the possibility that the euro note you hold can either be worthless or in the more optimistic case, be exchanged back at a steep discount to the national currency, what will your natural options be? You will avoid European equities and bonds because they are denominated in euros. You might want to change into a currency like the USD that will hold its value or you might want to buy physical gold which is harder to devalue or you might want to invest into a gold ETF denominated in the USD like GLD to avoid the storage and insurance costs. This is why we can see that the value of gold, as seen in the SDPR Gold Trust ETF (NYSEARCA: GLD ), has rose steadily since 03 November 2014 whenever there is a hint of potential political instability in Greece. (click to enlarge) As we can see, the market is forward looking and has began to price in the Greek instability before the formal vote in the Hellenic Parliament. Gold investors started to buy when the rumor of the a potential change in government given the weakness of the current Greek coalition government. This is why we are unlikely to see a sudden spike up in GLD now because the market has sufficient time to build their long position. Even for those who are less connected, they will have seen in coming last month when the rounds of Presidential election failed in Parliament. History of Debt Concession However now that Syriza has formed the new government,it remains to be seen how far its leader Tsprais will go to fulfill his campaign promises. It is clear that he will want to extract some sort of concession from the Troika. The prior Greek government managed to extend the loan repayment period from the original 7 years to 15 years in July 2011 and interest rates were cut to 3.5% for a mega loan of $109 billion euros loan package. This is the start of the second and ongoing Economic Adjustment Program for Greece after the first program which saw loans of $110 billion euros from May 2010 to June 2011. It is also in this period where we saw a soft default on a debt restructuring deal which concluded on 09 March 2012 on $205.5 billion euro of debt. This caused the ISDA to call a Credit Event which triggered $3.5 billion of credit default swaps and let Fitch to downgrade Greek debt from ‘CCC’ to ‘Restricted Default’. All in all, through this soft default option, Greek debt holders lost a massive $107 billion euros, a record for sovereign debt losses. Is this the calm before or after the Storm? As far as the market is concerned, the eurozone has survived this crisis of soft default with the help of the ECB when other organization were unable to convince the market. This soft default option is therefore unlikely to affect the market drastically. In other words, the extent and pretend scheme coupled with significant haircut works to preserve the eurozone even if it caused dismay to bond holders. Now the market is waiting to see if Syriza will actually dare to defy the Troika and simply walk away from its debt given the consequences. As this Reuters report shows, even as early as 04 November 2014 (coinciding with the rise of gold prices), when Syriza gets closer to power, it has proceeded to soften its stance from the choice of hard default to renegotiation. The German/ Creditor’s position is clear. They are willing to accept a debt restructuring but they will not accept a hard default or any cancellation of debt. This will weaken their position with other debtor countries like Poland, Ireland and Spain. The only risk now is that Syriza will overtip its hand when asking for concessions to the point where it is unacceptable to the Creditors. This is a possibility given the nature of his fiery speech and the expectations of quick relief from the Greek public. (click to enlarge) Source: Google There is a possibility that he will be too engrossed about the quick fix of Greek 175% debt to GDP ratio, which is higher than the rest of Europe. There is also the temptation to turn the Greek’s primary budget surplus of $3.3 billion euros for year 2015 to a current account surplus if they don’t pay off their external debts. The real risk is that Tsprias might then be too willing to leave the eurozone and underestimate the possibility of the hyperinflation tragedy. This might happen when the drachma is reintroduced at a point where the international market has no confidence in it shortly after a massive debt default. Conclusion GLD has appreciated way before the actual victory of Syriza and those who wanted to hold gold already has gold exposure in their portfolio. These are the cautious ones. For the vast majority of the public, it is the fear for systemic unrest on the scale of Lehman Brother collapse that will bring them into gold in doves. This fear will only occur when there are clearer signs of a disorderly Greece Exit (or Grexit). While we believe that Syriza was only posturing to gain power and it might be slightly more aggressive than the outgoing New Democracy government, there is also a serious risk that the inexperienced Syriza will overturn its hand and oversee the expulsion of Greece from the eurozone under its watch. There might be other forces that might tilt the balance inside and outside Syriza towards a cold calculation of benefits and costs that might result in unexpected results. There is still market confidence in the USD and GLD. For those who are upset about the lack of audit for GLD, consider it from the faith and credit angle. Based on the market capitalization of $30.78 billion and last known daily volume of 6.27 million, it is clear that there is market confidence in GLD and you can liquidate it quickly when you need it. However for those in Europe who are worried about capital controls, then it will make sense for them to hold physical gold but they will have to incur cost for storage and insurance. Then there is also the security risk for holding gold against theft or worst. For them, in today’s world without capital controls in Europe, GLD will be a good way to hold their wealth. For investors in general, they would do well to hold onto their GLD holdings especially for those who heeded my earlier advice to buy GLD in my earlier article, The SNB Catalyst For GLD . That article also explored the potential European instability from a different perspective. For those who have nil exposure to GLD, this will be a good time to gain exposure when there will be a brief lull in prices as the market wait and observe the actions of the new Greek government and the official response from the Troika who represent the Creditors.