Tag Archives: learn-more

One Of The Best ETFs I’ve Found So Far: SCHD
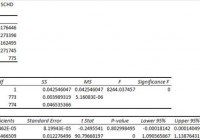
Summary I’m taking a look at SCHD as a candidate for inclusion in my ETF portfolio. The risk level, measured in standard deviation of daily returns is great. The ETF looks even better if combined with other major funds such as SPY. Investors should be seeking to improve their risk adjusted returns. I’m a big fan of using ETFs to achieve the risk adjusted returns relative to the portfolios that a normal investor can generate for themselves after trading costs. I’m working on building a new portfolio and I’m going to be analyzing several of the ETFs that I am considering for my personal portfolio. One of the funds that I’m considering is the Schwab U.S. Dividend Equity ETF (NYSEARCA: SCHD ). I’ll be performing a substantial portion of my analysis along the lines of modern portfolio theory, so my goal is to find ways to minimize costs while achieving diversification to reduce my risk level. What does SCHD do? SCHD invests in large dividend companies. It has shined in my first look at the fund. I was originally planning a 10 to 15% position for a dividend ETF, but now I’m contemplating raising that position up as high as 20 to 25%. At this point, the portfolio is still in the planning and funding stage. Does SCHD provide diversification benefits to a portfolio? Each investor may hold a different portfolio, but I use (NYSEARCA: SPY ) as the basis for my analysis. I believe SPY, or another large cap U.S. fund with similar properties, represents the reasonable first step for many investors designing an ETF portfolio. Therefore, I start my diversification analysis by seeing how it works with SPY. I start with an ANOVA table: (click to enlarge) At first look it may seem like the correlation of 91.42% would mitigate the diversification benefits of using SCHD with a major fund like SPY, but 91% still offers some meaningful benefits as long as the ETF can stand on its own strengths. In my opinion, SCHD passes that test and is a very viable candidate. Standard deviation of daily returns (dividend adjusted, measured since late 2011) This is the strongest area for the ETF. The returns are remarkably stable relative to most equity investments. Generally speaking, standard deviation of daily returns is the realm of SPY. Most ETFs look fairly poor when compared to just holding the S&P 500. The only reason those other equity ETFs can be useful under modern portfolio theory is diversification benefits when used as a fairly small percent of the portfolio. For the period I selected for comparison, the standard deviation on daily returns for SPY is 0.7754%. For SCHD the standard deviation of daily returns is 0.6651%. Mixing it with SPY I also run comparison on the standard deviation of daily returns for the portfolio assuming that the portfolio is combined with the S&P 500. For research, I assume daily rebalancing because it dramatically simplifies the math. With a 50/50 weighting in a portfolio holding only SPY and SCHD, the standard deviation of daily returns across the entire portfolio is 0.7124%. That is a very attractive risk position for a portfolio that only contains two ETFs. Why I use standard deviation of daily returns I don’t believe historical returns have predictive power for future returns, but I do believe historical values for standard deviations of returns relative to other ETFs have some predictive power on future risks and correlations. Yield The distribution yield is 2.52%. The SEC 30 day yield is 2.84%. For a dividend investor that wanted to minimize trading costs, that is a fairly strong yield on an ETF with less systematic risk than SPY. Expense Ratio The ETF is posting .07% for an expense ratio, which is very low. Market to NAV The ETF is trading at a .05% premium to NAV currently, but that is fairly close. A twentieth of one percent is not exposing an investor to a large risk in that regard. This value can change suddenly, so investors should check before submitting a trade. Largest Holdings The biggest holdings are around 4 to 5% of the portfolio. I prepared the following chart to break it down: (click to enlarge) I’m fairly happy with the construction of the top of the portfolio. At present, I’m not very optimistic on Verizon (NYSE: VZ ) or AT&T (NYSE: T ) because I think the industry risk is still being priced into the companies after Sprint (NYSE: S ) became much more aggressive. However, in the longer term (5 to 20 years) I think it makes sense to include them in the fund. Conclusion I’m currently screening a large volume of ETFs for my own portfolio. I’ll do a little more digging on SCHD later and post what I find. The portfolio I’m building is through Schwab, so I’m able to trade SCHD with no commissions. I have a strong preference for researching ETFs that are free to trade in my account. I’m expecting that SCHD will end up with a significant position in my portfolio.

GDXJ Re-Balancing Pummels These 5 Gold Developers

The Market Vectors Junior Gold Miners ETF (NYSEARCA: GDXJ ) is an ETF administered by Van Eck and created to replicate the Global Junior Gold Miners Index which is a basket of small-cap gold exploration, development and production companies. The GDXJ tries to maintain an average market cap of its holdings above $150 million. According to recent filings, the ETF’s largest holdings are Centamin ( OTCPK:CELTF ), IAMGOLD (NYSE: IAG ), Hecla (NYSE: HL ) and AuRico (NYSE: AUQ ), but included in the 69 total equity positions are exploration names such as Bear Creek Mining ( OTCPK:BCEKF ) and Focus Minerals ( OTCPK:FKSMF ). Needless to say, the ETF which mirrors the junior resource markets, hasn’t performed well. Year-to-date, it is down 18.18% but in the past 3 months the ETF is down over 40%. Recently, the GDXJ was re-balanced in order to maintain their average market capitalization hurdle. Given the performance of the underlying equities, the pre-revenue, development stories that have become less and less liquid were sold in favor of more liquid, higher market capitalization names such as IAMGOLD, AuRico and Alamos (NYSE: AGI ). As a result, some of these development companies have been crushed by this relentless selling. Asanko (NYSEMKT: AKG ), Premier Gold ( OTCPK:PIRGF ), Torex ( OTCPK:TORXF ), Rubicon (NYSEMKT: RBY ) and Midway (NYSEMKT: MDW ) were among them. Shares in those companies are down 23%, 25%, 22%, 17% and 15%, respectively over the past 30 days. Last Friday saw huge volume traded in these names as well. Asanko traded 28 million shares on Friday alone. The average daily volume traded over the past 3 months in Asanko is just 156,500 shares (the other names were similar). These companies have all outperformed the GDXJ year-to-date. Torex is up 24%, Premier up 19%, Rubicon up 8%, Asanko is flat on the year, Midway down 11%. The GDXJ on the other hand was down 25%. So perhaps the decision to cut these outperforming names wasn’t the best call afterall? Regardless, these teams have significantly de-risked their projects. Below is a summary of the milestones achieved this year: Torex – closed a $145 million equity financing and another $375 million project finance facility to build their Morelos project which is one of the highest-grade undeveloped open-pit gold projects in the world. They moved the construction of their project forward on time and on budget for a mid-2016 commercial production start-up. They also got $85 million worth of at-the-money warrants exercised (of $90 million) and made significant strides towards the development of their second mine, Media Luna. I doubt this company would get acquired before they complete construction and ramp-up, but come mid-to-late 2016 when the mine is running smoothly, I would expect a major to take them out (and likely at a significant premium). Since June 30, 2014, the GDXJ has sold 65.9 million Torex Gold shares in the market reducing their position by 57 Premier Gold – released a positive PEA on their Hardrock and Brookbank projects and followed that up with meaningful exploration results at their Cove Gold project. Recently, they were able to raise $9 million to continue de-risking these Canadian high-grade gold projects. Although earlier-stage, Premier could see a takeover bid come from one of the many companies looking for Canadian exposure to add to their project pipeline. Since June 30, 2014, the ETF sold 29.6 million shares, reducing their position by 73%. Rubicon Minerals – started the year with a $75 million streaming deal from Royal Gold, then followed that up with a $115 million bought deal financing. They continued to advance the construction of their Phoenix Gold project which they are touting as “Canada’s next high-grade gold mine”. With what management has delivered on so far and the expected production start-date of mid-2015, we believe that statement could prove to be true. Given the recent flight to safety by many global miners (see Osisko takeover battle), we view Rubicon as another likely takeover candidate given its postal code. 31.5 million shares of Rubicon have hit the market since June 30th, courtesy of the GDXJ. They reduced their position by 56%. Asanko Gold – had a truly transformational year. They successfully closed the acquisition of PMI Gold for roughly $180 million worth of stock in order to consolidate the two companies neighboring gold assets in Ghana. Shortly after, the company decided that the newly acquired, higher-grade mine from PMI would become the phase 1 project and outlined a path to get to 200,000 ounces of annual gold production by 2016. The company continued to de-risk the phase 1 development and worked on developing an integration plan for the second phase development which could see the company’s production double from 200,000 ounces to 400,000 ounces of gold annually, effectively catapulting the company into the mid-tier ranks. Next year looks to be another exciting year as the company completes construction and formally outlines the integration plan of the second phase of production. With Asanko’s board and management, this company could be a takeover target or could continue acquiring assets to grow their production profile. Asanko Gold saw its weighting in the GDXJ reduced by 37.9 million shares or roughly 77% since June 30th. Midway – broke ground on their heap leach gold project in Nevada and followed that up with the formalization of a joint venture with Barrick on the Spring Valley project which will see Midway carried to production at a 25% interest should Barrick chose to build it. Midway also announced the finalization of a project finance facility of $55 million and $25 million bought deal financing which allows the company to finish building Pan. The project is one of very few run-of-mine projects (means no crushing necessary) which enables it to be both technically straight forward as well as lower cost than other mines, making it a takeover candidate for anyone looking for simple heap leach projects in safe jurisdictions (of which there are many companies). Midway Gold saw the fewest shares hit the market with just 8.7% of its weighting in the GDXJ eliminated (roughly 1.1 million shares). Overall, the recent selloff in these names should be taken in context. All of the above teams are delivering on their promises, meeting or exceeding expectations, de-risking their projects and moving towards cash flow. An unrelated index re-balancing sale of these companies’ shares provide an opportunity for us as resource speculators. This is one of those times where I, as a speculator, finding myself questioning my investment thesis. Am I missing something? Does the market know something I don’t? In this case, I believe the selloff in the names is unrelated to the specific companies themselves or even the broader markets in general; it’s just a portfolio manager with a heavy finger. As a result, this re-balancing combined with the fact we are in the final days of tax-loss season provides an opportunity to gain exposure to high-quality gold development names. Disclosure: None Editor’s Note: This article covers one or more stocks trading at less than $1 per share and/or with less than a $100 million market cap. Please be aware of the risks associated with these stocks.

Cambria Introduces A Global Core Portfolio ETF With Zero Management Fees

Summary Mebane Faber’s Cambria Funds has added another ETF to its stable. The fund is a fund-of-funds comprising a core global portfolio of stocks, bonds, commodities and real estate. Cambria charges no management fees for the ETF. Acquired fees for the component funds are 0.29%. A Global Core Portfolio ETF With Zero Management Fees The latest ETF from investment iconoclast Mebane Faber is poised to be an industry disrupter. The Cambria Global Asset Allocation ETF (NYSEARCA: GAA ) is a fund of funds offering a global portfolio of stocks, bonds, commodities and real estate. “So,” you say, “what’s so disruptive about that?” Well, the ETF has no management fee beyond the acquired fees of the component funds. None. Acquired fund expenses amount to a mere 0.29%. Fig. 1. Still from Treasure of the Sierra Madre (1948). More on the fee structure later, let’s take a look at the fund first. The Fund The fund is a designed as a core global market portfolio, what Faber describes on ETF.com as a “one-stop shop for core global allocation… for super-low cost.” He goes so far as to ordain the fund the “global benchmark.” The table below lists the current portfolio. Fund Ticker Percent of Holdings Vanguard Tot Bond Mkt ETF (NYSEARCA: BND ) 8.09% Vanguard Emerging Mkt ETF (NYSEARCA: VWO ) 6.75% United States Comm Index (NYSEARCA: USCI ) 6.58% Vanguard Intl Bond ETF (NASDAQ: BNDX ) 5.07% Vanguard Emerg Mkts Gov B (NASDAQ: VWOB ) 4.90% Ishares MSCI USA Momentum (NYSEARCA: MTUM ) 4.09% Vanguard Mid-Cap ETF (NYSEARCA: VO ) 4.08% Vanguard Viper (NYSEARCA: VTI ) 4.07% Vanguard Europe Pac ETF (NYSEARCA: VEA ) 3.94% Mkt Vectors Em Lc Bd ETF (NYSEARCA: EMLC ) 3.85% Cambria Gloabl Value ETF (NYSEARCA: GVAL ) 3.80% Market Vectors Emer Hy (NYSEARCA: HYEM ) 3.77% Vanguard Reit ETF (NYSEARCA: VNQ ) 3.10% Cambria Shrhldr Yld ETF (NYSEARCA: SYLD ) 3.04% Ishares Lehman 7-10yr Trs (NYSEARCA: IEF ) 3.04% Ishares Iboxx Inv Gr Corp (NYSEARCA: LQD ) 3.03% SPDR Barclays TIPS ETF (NYSEARCA: IPE ) 3.00% Schwab U.S. TIPS ETF (NYSEARCA: SCHP ) 3.00% Vanguard Gbl X U.S. Re ETF (NASDAQ: VNQI ) 2.95% Ishares 20+Yrs Treas ETF (NYSEARCA: TLT ) 2.07% Vanguard St Bond ETF (NYSEARCA: BSV ) 2.01% Vanguard-S/T Corp ETF (NASDAQ: VCSH ) 2.01% Cambria Forgn Shrhldr ETF (NYSEARCA: FYLD ) 2.00% SPDR Barclays Int Corp (NYSEARCA: IBND ) 1.99% Vanguard Ftse All World (NYSEARCA: VSS ) 1.99% Spdr Barclays High Yield (NYSEARCA: JNK ) 1.99% Wisdomtree Em Small Cap (NYSEARCA: DGS ) 1.96% Market Vectors Intl (NYSEARCA: IHY ) 1.94% Cash 0.97% Wisdomtree Emg Mkts Eq (NYSEARCA: DEM ) 0.94% Here’s a couple of charts breaking the portfolio down at high-level geographic and asset class allocations. In the charts I’ve categorized the funds as Global (all-world), International (global ex. U.S.), Developed Markets ex. U.S., Emerging Markets, and Domestic (US) based on the individual funds’ mandates. I’ve not made any effort to break down the holdings by sub-categories within the funds. Obviously, Global would encompass all of the funds and International would encompass the two ex. U.S. categories but I’ve not done that here. (click to enlarge) Fig 2 and 3. Portfolio composition of Cambria Global Asset Allocation ETF . Charts by author. Data from Cambria . As we see, the portfolio breaks down to about half U.S. and half international. Slightly under half of the holdings is in bonds which cover sovereign and corporate debt at a full range of durations. There’s a 6.6% allocation to commodities, and 6% to real estate split equally between U.S. and international. The 36.7% that’s in stocks is split with about half in U.S. equity. If one adds the U.S. portion of the global funds, the mix would be slightly more than half in domestic securities. Zero Management Fee Now, about those fees. Or shall I say, the lack of fees? Surely no one opens an ETF without some reasonable expectation of turning a profit on it. How can they do that without charging fees? Two factors contribute to answer this question. First, according to Faber, this is an extremely low-cost fund to manage. GAA is essentially buy and hold. Although one assumes there will be some periodic rebalancing, the details are not discussed in the literature I examined. Furthermore, Faber claims that management is sufficiently lean and the fund is sufficiently cost-efficient that should it fails to raise a single dollar, the cost to Cambria will only be about $100,000. Or, to put it another way, the fund need only generate that $100,000 for Cambria to break even on it. But, with no fees, how can they generate even that amount? This raises the second point, and it is the key to making GAA viable. Three of the holdings are Cambria funds: SYLD, FYLD and GVAL, representing 8.84% of the portfolio. Faber claims that for a fund value of about $100M for GAA, the fees from those funds will generate sufficient revenue to Cambria for GAA to break even. To sum up, I see GAA an intriguing experiment. It provides exposure to a core global portfolio of 29 ETFs at absolutely minimal cost. An investor could buy the world market in its entirety with this single fund and simply forget about it. Doing so provides a truly passive, index investment. It will be interesting to follow how investors respond. If it succeeds it may well be remembered as the disruptive force Faber considers it to be.