Tag Archives: learn-more

Will Higher Physical Demand For Silver Drive Up SLV?
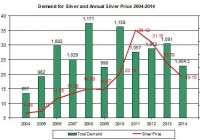
Summary The physical demand for silver has declined in 2014. Even if the demand were to pick up, the price of SLV may keep going down in 2015. The ratio of SLV to GLD gone up in 2014, which means SLV didn’t perform well compared to GLD. This year, the iShares Silver Trust ETF (NYSEARCA: SLV ) didn’t perform well as its price dropped by 18%. The low inflation, the FOMC’s change in policy and the drop in the price of gold contributed to the weakness of silver. Looking forward, even if the physical demand for silver were to pick up, it’s not likely to turn SLV back up. Let’s see why. Physical demand – does it matter? One of the main issues that bullion bulls point out is the changes in the demand for silver that could have an impact on the price of silver and SLV. But I think the changes in the physical demand played a secondary role on the price of SLV in recent years. The chart below presents the changes in demand for silver over the past decade and the average annual price of silver. Source of data Silver Institute and Reuters As you can see, the physical demand for silver seems to have limited impact on the price of SLV in the past few years especially. Back in 2008 the demand for silver reached its highest level in years, and SLV rose over $20, only to fall back by the end of the year to below $9 – so there was a reaction but it didn’t lead to staggering rise in SLV prices. Moreover, the spike in SLV prices during 2011-2012 doesn’t seem to relate to the changes in physical demand for the precious metal. During those years the demand didn’t increase compared to previous years. I also checked the changes in supply during those years — there was no a major shortage for silver on an annual scale more than in previous years. Conversely, even though the demand for silver grew in 2013, the price of SLV came down from its high levels of 2011-2012. Looking forward, HSBC still predicts higher demand for silver in 2015. This is why it retains its forecast price of silver at $17.65 per ounce. China, the world’s largest consumer of silver, will face economic challenges in 2015 – this could suggest China’s demand for silver may not increase any faster than it did in 2014. So the expected rise in physical demand may be harder to achieve next year. The other side of this equation is the changes in supply. In the past decade the supply, which mostly comes from mines, grew at a steady pace. This could change in 2015 as silver producers, which got use to the elevated price of silver over recent years, may taper down their output now that silver prices don’t provide a positive ROI for some of their mines. Such a shift, however, could take time to be reflected silver prices. And in any case, this is likely to be the secondary factor to impact SLV. The main issue is likely to be the changes in the demand for silver on paper, which is mostly driven by silver’s relation to gold, U.S. inflation expectations and treasuries yields. Let’s examine the first two. The issue related to treasuries yield you can see in this past post . This year, SLV has underperformed SPDR Gold Trust (NYSEARCA: GLD ). The relation between the two tended to be very strong and positive for the most part. Source of data: Google finance If GLD continues to remain flat or even slowly comes down, this likely to also bring down the price of SLV. The changes in U.S. inflation also tended to drive higher the price of SLV. The last time the U.S. inflation grew to over 10% was at beginning of the 1980. During that period, the price of silver spiked to around $48 for a very short time before it came back down along with the U.S. inflation. Back then, however, the story behind that spike and crash, which is known as Silver Thursday , was related to the Hunt bothers attempt to corner the silver market. But the rally of silver came even before the Hunt bothers tried to corner the market. Also, gold had a similar rise and fall in the early 80’s. The chart below presents the changes in U.S. core inflation (percent changes from a year back) and price of silver between 1978 and 1998. Source of data: FRED and Bloomberg In the past two decades, however, the U.S. inflation remained relatively flat – below 3%. But silver grew fast in 2011-2012. During those years, although the U.S. inflation remained low, the expectations for a sudden spike in inflation by bullion bulls were high. This is mainly due the FOMC’s policy of implementing its quantitative easing programs in low interest rates environment. Source of data: FRED and Bloomberg In the past few weeks the demand for SLV kept falling down: As of the end of last week, this ETF’s silver holdings have declined by 4% in the last two months. If the demand for silver for investment purposes continues to decrease, this is likely to bring down SLV. The potential fall in supply and expectations for a rise in physical demand may curb down the fall in SLV prices in 2015. But there are other factors that are likely to keep dragging down SLV: As the memories of the Fed’s QE programs remain in the rear view mirror, it becomes harder to see a sudden rise in inflation any time soon. Finally, if gold remains low and inflation doesn’t pick up, SLV isn’t likely to make a comeback in 2015.

Latest Low Carbon ETF Sees Huge Popularity Out Of The Gate

The ETF world is becoming increasingly competitive as issuers continue to line up new products to entice investors. While most try to please investors by charging low expense ratios, others have even attempted product charging a zero percent management fee. In this cutthroat competitive world, iShares has recently launched a product based on the low carbon emission idea. The newly launched iShares MSCI ACWI Low Carbon Target ETF (NYSEARCA: CRBN ) comes close on the heels of the recently launched SPDR MSCI ACWI Low Carbon Target ETF (NYSEARCA: LOWC ) by State Street. Though the two new funds are hardly distinguishable from each other and both look to provide exposure to companies with lower carbon and greenhouse gas emissions, below we have highlighted some of the details of the latest product on the block. CRBN in Focus The newly launched ETF tracks the MSCI ACWI Low Carbon Target Index to provide exposure to developed and emerging market equities with a lower carbon exposure than that of the broad market. For this purpose, the index goes overweight in companies with low carbon emissions relative to sales and per dollar of market capitalization. Also, the index supports companies that are less dependent on fossil fuels. This strategy results in the fund holding a well-diversified basket of 956 stocks. Apple occupies the top position with 1.82% exposure, followed by Microsoft (NASDAQ: MSFT ) (1.04%) and Johnson and Johnson (NYSE: JNJ ) (0.87%). Sector-wise, Financials dominates the fund with a little less than one-fourth exposure, followed by Information Technology with 13.7% allocation and Industrials with 11.7% exposure. Geographically, the U.S. takes the biggest chunk with half of the assets invested in it. This is followed by Japan (7.5%), U.K. (6.6%) and Canada (3.5%). The fund charges 20 bps in fees, including waivers. How Does it Fit in a Portfolio? The fund is a great choice for long-term investors, especially institutions looking to invest in a way that can have a positive impact on the broader economy. The impact of climate change worldwide and the detrimental consequences of the presence of greenhouse gases in the environment have become an important topic of discussion lately. People these days are more focused on socially responsible investing and the new fund is a good platform for them to do so. ETF Competition Though the socially responsible investing space has a lot of funds focusing on companies that are socially accountable, the focus on funds targeting low carbon emission companies is still quite low. However, the iPath Global Carbon ETN (NYSEARCA: GRN ) is one such product which focuses on this space. The fund tracks the Barclays Capital Global Carbon Index Total Return, which measures the performance of the most highly traded carbon-related credit plans. The ETN is, however, quite unpopular and illiquid with an asset base of under $3 million and an average volume of 4,000 shares a day. The product is also quite expensive as compared with the newly launched product and charges 75 basis points as fees. Apart from GRN, the newly launched CRBN is likely to face competition from another recently launched fund by State Street’s LOWC, as it also tracks the same index and charges the same fees. With that being said, CRBN has already established its popularity in just a few days of its launch and is presently the most successful ETF launch, by assets, since October, as per research firm XTF . CRBN has gathered roughly $137.8 million in assets since its inception on December 8 this month, while LOWC has managed to garner $71.13 million after its launch on November 25. This clearly indicates that CRBN is already winning in terms of popularity and might have great days ahead as well.

Under The Hood Of SPDR Barclays High Yield Bond ETF

By John Gabriel For strategic, long-term exposure to U.S. high-yield bonds, investors may consider SPDR Barclays High Yield Bond ETF (NYSEARCA: JNK ) as a small core holding. The fund can also serve as a tactical investment for the satellite portion of a diversified portfolio. Investors should bear in mind that high-yield bonds are one of the most volatile sectors of the fixed-income market. Long-term-minded investors looking to JNK as a strategic position are likely to find the diversification benefits of high-yield bonds attractive. High-yield bonds tend to be negatively correlated (or uncorrelated) with government and aggregate bond portfolios, which often make up the bulk of most investors’ fixed-income exposure. Moreover, high-yield bonds are poised to hold up relatively well in the event of rising interest rates and inflation. While rising rates and inflation tend to be the enemy of typical fixed-income securities, the high-yield bond asset class tends to outperform its fixed-income peers during such periods thanks to its stocklike returns and heavier dependence on business fundamentals. Consider that over the past 10 years, U.S. high-yield bonds have shown positive correlation (74%) with the S&P 500, while the Barclays U.S. Aggregate Bond Index has been relatively uncorrelated (26%) over the same period. Remember, interest rates will typically rise when the economy is in good shape and businesses are performing well. High-yield bonds tend to perform well when issuers’ fundamentals are strong or improving (and vice versa). Tactical investors may look to a fund like JNK as a way to bolster income in a yield-starved environment. However, investors should not look at the fund’s yield in isolation. Rather, the current yield should be viewed in relation to the yield offered by U.S. Treasuries with the same maturity. The difference between the two is what is known as the credit spread, and it represents the premium that investors can collect for assuming additional credit risk. The credit spread should also be viewed relative to the expected default rate. According to Moody’s, since 1983 the historical average default rate for high-yield bonds is 4.8%. In the trailing 12-month period through October 2014, the U.S. high-yield default rate was 2.4%, relatively flat from a year ago. Rising default rates typically result in widening credit spreads. But default rates are expected to remain low (around 2%) thanks to favorable credit conditions. Fundamental View The U.S. high-yield bond market has evolved over the past few decades. Whereas in the 1970s the overwhelming majority of high-yield bonds were so-called “fallen angels” (bonds issued by companies that had their credit ratings downgraded from investment-grade to high-yield status), today there is a vibrant and healthy market for new-issue high-yield bonds. According to SIFMA, in 2014, new issuance of high-yield bonds in the United States was $278 billion through October, slightly below the $285 billion sold in 2013 in the same period. By comparison, high-yield issuance averaged $95 billion per year from 1999 to 2009. Many investors may find the significant income potential of U.S. high-yield bonds attractive, particularly in the current low-yield environment. Their income potential is a primary point of appeal that attracts investors to the high-yield corporate-bond market. Indeed, there are very few other investments that offer high- to mid-single-digit yield potential in the current market environment. But other factors to consider include the asset class’ diversification benefits as well as its ability to withstand the impact of rising interest rates, potential inflation, and an uptick in the instance of default. U.S. high-yield bonds offer a favorable risk/reward profile relative to other major asset classes thanks to their equitylike returns with significantly less volatility. Owing to its generous yield, the Bank of America Merrill Lynch High Yield Master II Index (the generally accepted benchmark for the asset class) generated an annualized total return of 7.6% over the past 15 years. This compares to a total return of about 4.6% for the S&P 500. But the BofAML HY Master II Index’s annual standard deviation over that period was 9.9%, compared with 15.3% for the S&P 500. Adding a stake in high-yield bonds to complement aggregate bond exposure can help improve a portfolio’s diversification benefits. In fact, over the past five years, high-yield bonds have been uncorrelated (12%) with the Barclays U.S. Aggregate Bond Index. The asset class’s lack of correlation with investment-grade bonds and its negative correlation with government bonds should be an advantage when we finally see the inevitable rise in interest rates and potentially higher inflation. Of course, these advantages don’t come without risk. This economically sensitive asset class fell more than 32% in 2008 when the markets were roiled by the global credit crisis. Steady inflows from yield-starved investors have helped drive prices higher. The current option-adjusted credit spread between the BofAML HY Master II Index and U.S. Treasuries is about 4.4%. For some context, consider that the long-term average credit spread is about 6%. The all-time low of around 2.5% occurred in June 2007, while the all-time high occurred in December 2008 at the height of the credit crisis when the spread briefly spiked up to more than 20%. Fitch expects U.S. high-yield default rates will remain low through 2015 thanks to accommodative funding conditions and a recovering economy. Moreover, many of the highest risk issuers have taken advantage of favorable credit markets in recent years to extend their lifelines. Portfolio Construction This fund seeks to provide investment results that, before fees and expenses, correspond generally to the price and yield performance of the Barclays Capital High Yield Very Liquid Index. The index includes publicly issued U.S. dollar-denominated, non-investment-grade, fixed-rate, taxable corporate bonds that have a remaining maturity of at least one year. The fund uses a representative sampling strategy to track the index and currently has nearly 800 holdings. Its sector exposure is extremely concentrated, as industrials make up 89% of the portfolio. The financials sector makes up roughly 8%, while utilities round out the portfolio at about 4% of the benchmark. Issues rated BB and B make up 40% and 43% of the index, respectively. The remaining 17% is made up of issues rated CCC or lower. Currently, the fund’s modified adjusted duration is 4.38 years, and its weighted average yield to maturity is 6.39%. Fees This fund charges an expense ratio of 0.40% per annum. While this is quite a bit higher than those levied by funds tracking an aggregate bond index, it is cheap compared with actively managed funds in the same category. High-yield bonds tend to be more illiquid than investment-grade corporate bonds, which can make them comparatively expensive to trade. With an estimated holding cost of 0.72%, JNK reflects the challenges of employing a sampling strategy to track a relatively illiquid benchmark. Transaction costs explain the difference between the fund’s expense ratio and its estimated holding cost. Alternatives The closest alternative to JNK is iShares iBoxx $ High Yield Corporate Bond (NYSEARCA: HYG ) , which has a slightly higher expense ratio of 0.50% but a lower estimated holding cost of just 0.18%. HYG tracks the Markit iBoxx USD Liquid High Yield Index and also employs a representative sampling strategy. It currently has nearly 900 holdings and is much more diversified than JNK in terms of sector exposure. At 4.12 years, it has a slightly shorter duration than JNK. It also has a lower average yield to maturity of 5.59%. Another alternative for investors to consider is PowerShares Fundamental High Yield Corporate Bond ETF (NYSEARCA: PHB ) , which charges a 0.50% expense ratio. PHB seeks to outperform its cap-weighted peers by tracking a fundamental index developed by Research Affiliates, LLC. Investors concerned about the health of the economy and future default rates may favor PowerShares’ PHB, as its benchmark avoids the riskiest issuers (excludes issues rated below B). PHB has a comparable duration of 4.37 years, and its higher-quality portfolio offers a slightly lower yield to maturity of 5.05%. Investors concerned about the impact of rising interest rates may consider SPDR Barclays Short Term High Yield Bond ETF (NYSEARCA: SJNK ) or PIMCO 0-5 Year High Yield Corporate Bond ETF (NYSEARCA: HYS ) , which charge expense ratios of 0.40% and 0.55%, respectively. SJNK currently has a modified duration of 2.4 years, and its yield to maturity is 6.41%. HYS has a slightly lower duration of 1.96 years and currently offers an estimated yield to maturity of 5.47%. Disclosure: Morningstar, Inc. licenses its indexes to institutions for a variety of reasons, including the creation of investment products and the benchmarking of existing products. When licensing indexes for the creation or benchmarking of investment products, Morningstar receives fees that are mainly based on fund assets under management. As of Sept. 30, 2012, AlphaPro Management, BlackRock Asset Management, First Asset, First Trust, Invesco, Merrill Lynch, Northern Trust, Nuveen, and Van Eck license one or more Morningstar indexes for this purpose. These investment products are not sponsored, issued, marketed, or sold by Morningstar. Morningstar does not make any representation regarding the advisability of investing in any investment product based on or benchmarked against a Morningstar index.