Tag Archives: learn-more

Should I Have High Yield (Junk) Bonds In My Portfolio?
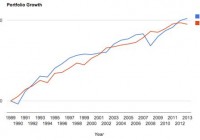
Summary By buying junk bonds I would take on more risk. The trade off is I would expect better returns. Do high yield junk bonds belong in my portfolio? Junk Bond Risks Companies that have low credit ratings pay higher interest rates, but of course those rates come with higher risk of default. Below we show data from Fitch that shows historical default rates. Non-investment grade (junk) rating consists of data rated BB and below. As can be seen default rates rise quickly as rating grades get worse. Fitch Global Corporate Finance Average Cumulative Default Rates: 1990-2013 1 year 2 year 3 year 4 year 5 year 10 year AAA 0 0 0 0 0 0 AA 0.03 0.03 0.07 0.13 0.19 0.24 A 0.08 0.22 0.38 0.52 0.71 1.82 BBB 0.19 0.66 1.19 1.76 2.36 4.64 BB 1.09 2.68 4.27 5.71 6.95 10.94 B 1.94 4.54 6.87 9.01 10.88 11.44 CCC to C 23.51 31.48 34.96 37.01 39.58 39.54 Investment Grade 0.11 0.35 0.61 0.88 1.17 2.27 Speculative Grade 2.88 5.33 7.38 9.16 10.70 13.38 All Corporate Finance .73 1.43 2.04 2.59 3.07 4.07 It is wise to keep in mind that during severe market corrections ratings tend to get downgraded and default rates increase. Fitch-Rated Global Corporate Finance Issuer Default Rates Default Rates 1990-2013 Year Default Rate (%) 1990 1.36 1991 2.25 1992 0.65 1993 0.00 1994 0.00 1995 0.11 1996 0.29 1997 0.08 1998 0.42 1999 0.85 2000 0.38 2001 0.90 2002 2.17 2003 1.16 2004 0.12 2005 0.32 2006 0.07 2007 0.10 2008 1.28 2009 2.58 2010 0.49 2011 0.30 2012 0.65 2013 0.51 As we can see above during both the Tech Wreck and the Great Recession defaults increased substantially. Junk Bond Returns compared to 5 Year Treasuries Portfolio Visualizer provides some excellent tools for backtesting. I used their tools to generate a backtest for comparing High Yield Bonds to 5 Year Treasuries. Portfolio 1 – High Yield Bonds – As represented by Vanguard High Yield Corporate (MUTF: VWEHX ) Portfolio 2 – Five Year Treasuries (click to enlarge) (click to enlarge) As shown about High Yield bonds did return slightly more, but had a much larger maximum drawdown and worse risk adjusted returns based on the Sharpe Ratio and the Sortino Ratio. (click to enlarge) The year -by- year comparison shows that treasuries performed well when the equity market was correcting while High Yield bonds performed poorly. Conclusions Junk Bonds had a slightly higher CAGR over the 1990-2013 time frame, but the advantage was small 7.11% to 6.59% and Junk Bonds actually trailed the treasuries from 1990-2011. Was the small advantage in CAGR worth the risk? The maximum drawdown for the junk bonds was -21.29% the max drawdown for the Treasuries was -4.33%. Junk bonds had a Sharp Ratios of 0.41 and Sortino Ratio of 0.75 compared to a Sharpe Ratio of 0.59 and a Sortino Ratio of 1.40 for the treasuries. I’m semi-retired and bonds are the low-risk part of my portfolio. The possibility of a 20% plus drawdown in the ‘safe’ part of my portfolio makes be lean toward selecting the treasuries. When you add in the fact that the high-yield bonds barely beat the treasuries in total returns it’s a no-brainer. Not only did junk bonds have larger drawdowns they had them at the worst possible time. When equities were taking a beating in 2008 High Yield bonds were going right down with them: -21.29%. Treasuries were up 13.32% in 2008; this is exactly the kind of negative correlation I want my bond holding to display during an equity market correction. Junk bonds have taken a hit lately and the spread between high yield and investment grade bonds has widened. Some investors may view this as an opportunity. I still do not view the risk/reward favorably. If I need higher returns I would be inclined to add more equities and keep my bond investments in Treasuries or investment grade corporate bonds. Bonds are in my portfolio to provide safety, smoothing out my returns and keeping me from having to sell losing investments during a correction. Junk Bonds don’t fit the bill. I won’t be adding junk to my portfolio. I am not a professional advisor or researcher. I am an individual investor who studies investing and shares my thoughts. I encourage all investors to do their own due diligence and please share your findings. I strongly feel the best thing about Seeking Alpha is the sharing of ideas. Please comment; I value your input. Divergent opinions are welcome.

A Top-Ranked India ETF To Tap The Growing Consumer Sector

The Indian stock market has hardly looked back from the astounding journey it set forth on in May 2014 following the formation of the new government. Most economic factors are presently in favor of Asia’s third-largest economy, including the revival of the currency, a drastic fall in inflation thanks mainly to the oil price crash and an improvement in current account deficit. India’s wholesale price inflation – which was an acute concern leading to a series of rate hikes in the past couple of years – plunged to a five-year low in September. Though India’s Q3 GDP growth rate of 5.3% was not great, analysts from HSBC expect over 6% growth rate from this nation next year. This is noteworthy since the nation’s bourses suffered a lot last year as foreign investors remained skittish about putting more capital in the nation, leaving many questions about the potential of the country in the near term. Actually, given that India isn’t a commodity-oriented emerging market like its BRIC brothers Brazil or Russia, the nation has immensely benefited from the recent natural resource weakness. If this is not enough, Credit Suisse forecasts that Indian economy will log ‘fastest USD nominal growth in the world’ next year as noted by Reuters. To add to this, Credit Suisse believes that Indian equities are not pricey relative to the nation’s growth outlook. This recent bullish tone did spread cheers across every corner of the Indian economy as evident by at least a 25% return received from each India ETF this year. However, some specific corners need special mention. One such space is the Indian consumer sector. What Drives Consumer Sector Higher? The middle income population in India is mushrooming. This fraction of the population has an inclination to spend on discretionary items like travel and leisure which in turn boosts the sales of consumer products like automobiles and personal goods. For example, auto sales displayed a speedy annual expansion of 10% in November (yoy). Notably, auto sales are often regarded as a well-being of an economy. Lower fuel prices seemed to have done the trick. Moreover, with cooling inflation, many are speculating a rate cut in the coming days, though no such thing has taken place formally as of yet. And if in any case, the interest rate goes down, the auto industry should soar. India basically has a compelling investment proposition with its rising importance as a ‘consumer driven’ economy. As per Indian Brand Equity Foundation (IBEF), the present consumer spending will likely grow two-fold by 2025. The consumer confidence score rose to 126 in Q3 of this year from an all-time low of 92 reached in Q1 of 2010. The market is motivated by favorable demographics and expanding disposable income. IBEF also predicts that per capita income in India will likely see a meaningful CAGR of 5.4% within the span of 2010-2019 with food products and personal care taking about 65% share of the market revenue. Other forecasts by IBEF include doubling of the consumer durables market by FY15 from FY10. The young generation’s inclination toward tech-driven products will also facilitate this growth trajectory. This calls for a bullish stance over the consumer sector of the Indian economy. Here we would like to highlight the Zacks top-ranked ETF providing exposure to this very corner of the Indian market. EGShares India Consumer ETF ( INCO ) has a Zacks ETF Rank #1 (strong Buy) with a Medium risk outlook and we expect it to outperform most of its peers in the coming months meaning it could be an excellent pick for investors seeking more exposure to this economy. INCO in Focus This ETF targets the consumer industry of India and follows the Indxx India Consumer Index. It holds 30 stocks in its basket and has amassed $21.5 million in its asset base. The fund trades in a paltry volume of 15,000 shares, suggesting additional cost in the form of wide bid/ask spread beyond the expense ratio of 0.89%. The fund offers a moderately concentrated bet in the top 10 holdings as indicated by its 52% exposure to these stocks. Among individual holdings, MRF Ltd., Motherson Sumi Systems Ltd. and Bosch Ltd form the top positions of the fund with total investment of 17.7%. The fund allocates 79.42% of its asset base to consumer goods. A small proportion of the asset base has also been assigned to Industrials (15.4%) and Consumer Services (4.8%). Industry-wise, automobiles – which is presently a well-performing sector in India – accounts for 37.5% followed by personal goods (27.14%) and industrial engineering (15.4%). INCO has hit a low of $19.64 and a 52-week high of $34.89. The fund is currently hovering near its 52-week high price and could be an interesting choice in 2015 for investors seeking more Indian market exposure.

Federated Launches New Fund, Expands Alternatives Division

On December 17, Federated announced it was putting the Federated Prudent Bear Fund (MUTF: FVOAX ) under its alternatives/managed-risk product umbrella, expanding that fast-growing division. Federated’s alternative and managed-risk products, which are overseen by Michael Dieschbourg, include managed volatility, absolute return, and managed-tail risk strategies, in addition to the recent arrival of the Prudent Bear Fund. Federated’s Managed Volatility Fund had just launched on December 15, two days prior to the migration of Prudent Bear to Federated’s alternatives division. Both moves are seen as efforts by Federated to enhance its alternatives and managed-risk product team, on the heels of the explosive growth of liquid alts in 2014 and ahead of what’s likely to be another big year for the category in 2015. The Federated Managed Volatility Fund’s objective is to provide total return while minimizing volatility. Its co-advisors pursue this goal by investing in equity and fixed-income securities “with total return potential,” and overlay a managed volatility component to achieve a long-term volatility target of 10%, according to its prospectus . The fund has three co-advisors: Federated Equity Management Company of Pennsylvania (FEMCO), which specializes in the equity portion of the fund’s portfolio, including equity-based derivatives; Federated Investment Management Company (FIMCO), which specializes in the fixed-income portion of the fund’s portfolio; and Fed Global, which along with FEMCO, implements the fund’s managed volatility portion using futures contracts. A couple key points from the prospectus regarding the allocation to equities and fixed income securities : Regarding the composition of the Fund’s portfolio, under normal conditions, it is anticipated that approximately 40% of the Fund’s assets will be invested directly into equity securities and 60% of the Fund’s assets will be invested in fixed-income securities and other investments. Fed Global and FEMCOPA may vary this allocation by +/- 10% for each asset class depending upon its economic and market outlook, as well as a result of favorable investment opportunities. A couple key points from the prospectus regarding the volatility overlay : The Federated Managed Volatility Fund is available in three share-classes: A (FVOAX), C (MUTF: FVOCX ), and IS (MUTF: FVOIX ); with a management fee of 0.75% and respective net-expense ratios of 1.05%, 1.8%, and 0.8%. The minimum initial investment for A- and C-class shares is $1,500; the minimum for institutional-class shares is $1 million. Although the growth in the liquid-alts product category is leading the launch of more alternative mutual funds and ETFs, and the expansion of many large firms’ alternatives divisions, not everyone is experiencing the growth equally. Douglass Nolan, a former manager of the Federated Prudent Bear Fund, has left or is leaving the fund. A December 17 SEC filing from Federated instructs investors to delete the information referencing Mr. Nolan from the Prudent Bear Fund’s prospectus “in its entirety,” but that the change won’t take effect until December 31.