A Most Competitive Wealth-Builder ETF Investment Today
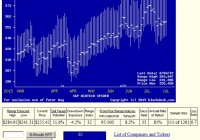
Summary From a population of some 350 actively-traded, substantial, and growing ETFs this is a currently attractive addition to a portfolio whose principal objective is wealth accumulation by active investing. We daily evaluate future near-term price gain prospects for quality, market-seasoned ETFs, based on the expectations of market-makers [MMs], drawing on their insights from client order-flows. The analysis of our subject ETF’s price prospects is reinforced by parallel MM forecasts for each of the ETF’s ten largest holdings. Qualitative appraisals of the forecasts are derived from how well the MMs have foreseen subsequent price behaviors following prior forecasts similar to today’s. Size of prospective gains, odds of winning transactions, worst-case price drawdowns, and marketability measures are all taken into account. Today a most attractive ETF Is the SPDR Biotech ETF (NYSEARCA: XBI ). The investment seeks to provide investment results that, before fees and expenses, correspond generally to the total return performance of an index derived from the biotechnology segment of a U.S. total market composite index. In seeking to track the performance of the S&P Biotechnology Select Industry Index (the “index”), the fund employs a sampling strategy. It generally invests substantially all, but at least 80%, of its total assets in the securities comprising the index. The index represents the biotechnology industry group of the S&P Total Market Index (“S&P TMI”). The fund is non-diversified. The fund currently holds assets of $2.71 billion and has had a YTD price return of +35.66%. Its average daily trading volume of 1,126,650 produces a complete asset turnover calculation in 9.4 days at its current price of $255.09. Behavioral analysis of market-maker hedging actions while providing market liquidity for volume block trades in the ETF by interested major investment funds has produced the recent past (6 month) daily history of implied price range forecasts pictured in Figure 1. Figure 1 (used with permission) The vertical lines of Figure 1 are a visual history of forward-looking expectations of coming prices for the subject ETF. They are NOT a backward-in-time look at actual daily price ranges, but the heavy dot in each range is the ending market quote of the day the forecast was made. What is important in the picture is the balance of upside prospects in comparison to downside concerns. That ratio is expressed in the Range Index [RI], whose number tells what percentage of the whole range lies below the then current price. Today’s Range Index is used to evaluate how well prior forecasts of similar RIs for this ETF have previously worked out. The size of that historic sample is given near the right-hand end of the data line below the picture. The current RI’s size in relation to all available RIs of the past 5 years is indicated in the small blue thumbnail distribution at the bottom of Figure 1. The first items in the data line are current information: The current high and low of the forecast range, and the percent change from the market quote to the top of the range, as a sell target. The Range Index is of the current forecast. Other items of data are all derived from the history of prior forecasts. They stem from applying a T ime- E fficient R isk M anagement D iscipline to hypothetical holdings initiated by the MM forecasts. That discipline requires a next-day closing price cost position be held no longer than 63 market days (3 months) unless first encountered by a market close equal to or above the sell target. The net payoffs are the cumulative average simple percent gains of all such forecast positions, including losses. Days held are average market rather than calendar days held in the sample positions. Drawdown exposure indicates the typical worst-case price experience during those holding periods. Win odds tells what percentage proportion of the sample recovered from the drawdowns to produce a gain. The cred(ibility) ratio compares the sell target prospect with the historic net payoff experiences. Figure 2 provides a longer-time perspective by drawing a once-a week look from the Figure 1 source forecasts, back over two years. Figure 2 (used with permission) What does this ETF hold, causing such price expectations? Figure 3 is a table of securities held by the subject ETF, indicating its concentration in the top ten largest holdings, and their percentage of the ETF’s total value. Figure 3 source: Yahoo Finance XBI apparently takes a low-concentration approach to holdings, with an average of 1½% of its assets in each of its top ten commitments. This provides a wide dispersion of holdings among competitive contestants in an industry where success rewards can be huge, while failures tend to be complete. If the remaining 88% of assets are distributed on a 1% basis over 85 separate additional bets may be made, offering great diversification, as well as dilution of encountered bonanzas. Where ultimate payoffs are less dependent on initial capital commitment size, this may be an advantaged strategy. Figure 4 is a table of data lines similar to that contained in Figure 1, for each of the top ten holdings of XBI. Figure 4 (click to enlarge) In an industry as unpredictably dynamic as this, wide variations in market experience seem to be the rule. Column (5) contains the upside price change forecasts between current market prices and the upper limit of prices regarded by MMs as being worth paying for price change protection. The average of +18.9% of the top ten XBI holdings is well above the population average of all 2500+ equities MM forecasts of +12.6%. It is about triple the upside forecast for the SPDR S&P 500 Trust ETF ( SPY) price change prospects. The other side of the coin is column (6), which shows what actual worst-case price drawdowns have been typical in the 3 months following each time there has been a forecast like those of the present day. Those risk exposures have averaged -10% in the holdings top ten, worse than -8.6% by equities at large, and only -3.3% on the SPY ETF. But these holdings have attractive reward tradeoffs between returns and risks, with the top ten (column 14) at a ratio of 1.8, compared to equities overall at 1.5 times. Still, the market average of SPY provides a best ratio of 2.1 times risk avoidance, at a cost of small reward. Another qualitative consideration is the credibility of the ten XBI big holdings after previous forecasts like today’s. The net average price change (column 13) of the ten has been 0.8 times the size of the upside forecast average, +18.9% compared to +15.6%. The equity population’s actual price gain achievement, net of losses has been a pitiful +3.4% compared to promises of 12.6%. The ability of XBI holdings to recover from those worst-case drawdowns and achieve profits occurred in 70% of experiences. The equity population only recovered less than two thirds of the time, and while the SPY experiences were more resistant than the ten XBI holdings, the achieved gains were much smaller. SPY has had only +3.7% gains previously from like forecasts of +6.8%. Conclusion XBI provides attractive forecast price gains, supported by its equally appealing largest holdings. Both the ETF and many of its major holdings offer very attractive prospects in near-term price behaviors, demonstrated by previous experiences following prior similar forecasts by market makers. The diversity of its holdings is very broad, providing a wide opportunity to share in constantly developing discoveries across the biotechnology field. Disclosure: I/we have no positions in any stocks mentioned, and no plans to initiate any positions within the next 72 hours. (More…) I wrote this article myself, and it expresses my own opinions. I am not receiving compensation for it (other than from Seeking Alpha). I have no business relationship with any company whose stock is mentioned in this article.