Tag Archives: investing ideas

Puerto Rico Debt Worries Loom: 2 ETFs To Watch

While Greece recently defaulted on its payments to the International Monetary Fund, America’s island Puerto Rico has managed to avert a last minute July 1 default giving some relief to its creditors. The island has paid back $645 million of general obligation bonds along with a $415 million installment from the troubled Puerto Rico Electric Power Authority (PREPA). Moreover, Puerto Rico has paid back a short-term bank loan of about $245 million. Though the last minute payment has helped the island to buy some time to negotiate with its creditors, it still has a huge debt load to repay in the coming months and years. In fact, the island has a massive debt load of $72 billion amassed by the government and its agencies. The government owned utility company – PREPA – is crippled by debt and is in talk with creditors to renegotiate its $9 billion of debt. Though Puerto Rico has managed to avert the default, Moody’s Investors Service has cut about $56 billion of Puerto Rico’s other bonds into junk category . The island has been in recession for nearly a decade and there are meager chances of its paying back its debt. This is especially true as many residents of the island are moving to the mainland U.S. in search of better job opportunities which further reduces the island’s tax base. The island’s debt problems also have a significant bearing on the financial market and the investor community, given the fact “estimated in 2013 that 180 mutual funds in the United States and elsewhere have at least 5% of their portfolios in Puerto Rican bonds,” as per investment research firm Morningstar, in a report for USA Today . Apart from mutual funds, a lot of ETFs also have exposure to Puerto Rican debt. Below we have highlighted two ETFs which have significant exposure to Puerto Rican bonds. SPDR Nuveen S&P High Yield Municipal Bond ETF (NYSEARCA: HYMB ) The fund tracks the S&P Municipal Yield Index, measuring the performance of high yield municipal bonds issued by U.S. states and territories or local governments or agencies. Puerto Rico takes the second spot with 10.45% exposure in the fund, ahead of California which has 12.7% allocation. The fund has a portfolio of 432 bonds with an average maturity of 19.74 years and a 30-day SEC yield of 4.60%. Sector-wise, Industrial Revenue takes the top spot with 28.3% allocation, followed by Healthcare and Special Tax each with double-digit exposure. The fund manages an asset base of $393.5 million and trades with moderate volume of 75,000 shares a day. The ETF currently has a Zacks Rank #4 or Sell rating. Short High-Yield Municipal Index ETF (NYSEARCA: SHYD ) The fund tracks The Barclays Municipal High Yield Short Duration Index giving exposure to the high-yield municipal bond market. The fund holds a total of 328 bonds with a modified duration of 3.96 years and a weighted average maturity of 7.23 years. SHYD has a 30-day SEC yield of 3.39%. Puerto Rico has 4.5% weightage in the fund. Sector-wise, Industrial Revenue takes the top spot with a little more than one-third assets, followed by HealthCare (22.6%) and Transportation (10.1%). The fund manages a small asset base of $105.4 million and trades with low volume of less than 30,000 shares a day. SHYD also has a Zacks Rank #4. Original Post
QQQ’s 2015 2nd-Quarter Performance And Seasonality

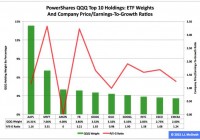
Summary The large-capitalization PowerShares QQQ behaved better in the first half than did the large-cap SPDR S&P 500 ETF. In the second quarter, the adjusted closing daily share price of the derivative of the Nasdaq-100 Index rose by 1.63 percent. In June, the fund’s share price fell by -2.48 percent. PowerShares QQQ’s (NASDAQ: QQQ ) adjusted closing daily share price in 2015’s first half ascended to $107.07 from $103.01, a climb of $4.06, or 3.94 percent. During the period, the ETF behaved better than the SPDR S&P 500 ETF (NYSEARCA: SPY ) by 2.83 percentage points and worse than the SPDR S&P MidCap 400 ETF (NYSEARCA: MDY ) and the iShares Core S&P Small-Cap ETF (NYSEARCA: IJR ) by -14 and -8 basis points, in that order. QQQ last quarter led SPY, IJR and MDY by 1.40, 1.46 and 2.74 percentage points, respectively. And most recently, QQQ last month lagged IJR, MDY and SPY by -3.54 percentage points, 1.21 percentage points and 47 basis points, respectively. Comparisons of changes by percentages in QQQ, SPY, MDY, IJR and the small-cap iShares Russell 2000 ETF (NYSEARCA: IWM ) during the first half, over Q2 and in June can be found in charts published in “SPY’s 2015 2nd-Quarter Performance And Seasonality.” Figure 1: PowerShares QQQ Top 10 Holdings, July 2 (click to enlarge) Notes: 1. The QQQ holding-weight-by-percentage scale is on the left (green), and the company price/earnings-to-growth ratio scale is on the right (red). 2. A meaningful P/E-G ratio is incalculable for the generally unprofitable Amazon.com Inc. ( AMZN ). Source: This J.J.’s Risky Business chart is based on data at Invesco’s PowerShares QQQ microsite and FinViz.com (both current as of July 2). QQQ’s constituent companies in general and its top 10 holdings in particular have a tendency to do big business in both domestic and foreign markets (Figure 1). Their sales’ geographic diversification has been an issue during the past year and will be an issue over the next year primarily because of the bias divergence in monetary policy at large central banks around the world, with the U.S. Federal Reserve oriented toward tightening and all the others oriented toward loosening. This bias divergence has had major effects on multiple financial markets, such as those centered on currencies. It has led to a stronger U.S. dollar on the one hand and a weaker euro, a weaker Japanese yen, a weaker British pound, a weaker Canadian dollar, a weaker Swedish krona and a weaker Swiss franc on the other hand. Accordingly, American products and services can cost more than their foreign-based competitors’ offerings in July 2015 than they did in July 2014. Apple Inc. (NASDAQ: AAPL ) does not compete materially on price, but many of QQQ’s constituent companies do so in their foreign markets. And I suspect the currency issue played a role in the first quarter, when only six of the ETF’s top 10 holdings beat their analysts’ consensus earnings estimates, according to Zacks . Meanwhile, these holdings’ P/E-G ratios indicate they are more dear than cheap, with equity-market participants assigning these firms valuations ranging from the apparently insane, Amazon.com, to the seemingly sane, Gilead Sciences Inc. (NASDAQ: GILD ). Figure 2: QQQ Monthly Change, 2015 Vs. 2000-2014 Mean (click to enlarge) Source: This J.J.’s Risky Business chart is based on analyses of adjusted closing monthly share prices at Yahoo Finance . QQQ performed a lot better in the first half of this year than it did during the comparable periods in its initial 15 full years of existence based on the monthly means calculated by employing data associated with that historical time frame (Figure 2). The same data set shows the average year’s weakest quarter was the third, with a relatively small negative return, and its strongest quarter was the fourth, with an absolutely large positive return. Figure 3: QQQ Monthly Change, 2015 Vs. 2000-2014 Median (click to enlarge) Source: This J.J.’s Risky Business chart is based on analyses of adjusted closing monthly share prices at Yahoo Finance. QQQ performed a lot worse in the first half of this year than it did during the comparable periods in its initial 15 full years of existence based on the monthly means calculated by using data associated with that historical time frame (Figure 2). The same data set shows the average year’s weakest quarter was the first, with a relatively small positive return, and its strongest quarter was the fourth, with an absolutely large positive return. Disclaimer: The opinions expressed herein by the author do not constitute an investment recommendation, and they are unsuitable for employment in the making of investment decisions. The opinions expressed herein address only certain aspects of potential investment in any securities and cannot substitute for comprehensive investment analysis. The opinions expressed herein are based on an incomplete set of information, illustrative in nature, and limited in scope. In addition, the opinions expressed herein reflect the author’s best judgment as of the date of publication, and they are subject to change without notice. Disclosure: I/we have no positions in any stocks mentioned, and no plans to initiate any positions within the next 72 hours. (More…) I wrote this article myself, and it expresses my own opinions. I am not receiving compensation for it (other than from Seeking Alpha). I have no business relationship with any company whose stock is mentioned in this article.

ALPS Adds New Twist To Equal-Weighted ETF Products

By DailyAlts Staff ALPS Holdings has been a leader in providing innovative investment products and customized solutions since its founding in 1985. On July 1, the firm added two new products to its repertoire: The ALPS Sector Leaders ETF (NYSEARCA: SLDR ) and the ALPS Sector Low Volatility ETF (NYSEARCA: SLOW ), both of which are equal-sector weighted, to avoid the loss of diversification benefits associated with over- or under-weighting particular sectors. Equal-Weighted Investing One of the major knocks against market capitalization-weighted indexes is that they inherently overweight overvalued stocks, and underweight undervalued stocks. In addition, they have a significant bias toward the largest companies in their respective universe. For instance, if the S&P 500 Index were equal-weighted, Apple would account for just 1/500 of the index’s total, as opposed to the roughly 4% it constitutes on a cap-weighted basis. Smart beta products provide an alternative approach to weighting investments. Most smart beta strategies use “factors” such as value, momentum, quality or low volatility to determine their investment weights, but a simpler approach is to weight all investments within an index or fund equally. Thus, equal weighting ends up avoiding the large-cap, or even mega-cap bias that many capitalization weighted indices have. The ALPS ETF Approach The new ALPS ETFs are part of the ALPS Factor Series. They’re “smart beta” products in that they select investments according to fundamental factors, including growth, quality, and low volatility. But investments held by the ETFs are weighted so that each business sector has equal representation – this mitigates the risk of being overly concentrated in an overheated sector, or being underweight an undervalued sector. “Rather than investing in pure market-cap indexes, which are usually tilted towards specific sectors, our equal sector weighting methodology may provide a better foundation for building diversified portfolios,” said portfolio manager Michael Akins, in a recent statement. “As a result, investors and advisors may achieve better risk adjusted returns.” Both ETFs will track S-Network indexes, which are designed to provide equal-weight exposure of selected investments across sectors and across securities. Both funds exclude REITs, and when evaluating sectors, combine the telecommunications sector with the information technology sector to form a single sector of the two. The ALPS Sector Leaders ETF will track the S-Network Sector Leaders Index – this index picks the 5 stocks from each of nine GICS sectors which, per the prospectus, demonstrate the best growth potential based on key characteristics associated with growth and quality, then equal weights all 45 stocks in the portfolio. The ALPS Sector Low Volatility ETF will track the S-Network Sector Low Volatility Index – this index picks the 5 stocks from each of nine GICS sectors that that have the lowest trailing twelve-month volatility as of the last trading day of November, then equal weights all 45 stocks in the portfolio. “It’s become clear that there’s an important place for the equal sector weighting strategies in most investment portfolios, particularly in volatile markets,” said Mr. Akins, who is also a Senior VP at ALPS Advisors and its Director of ETFs. “We’re excited at the prospect of applying the approach toward these historically proven factors and markets.” The management fee and expense ratio for each fund is 0.40%. For more information, visit alpsfunds.com .