Tag Archives: industry

Can Energy ETFs Regain Fervor On Capital Spending Cuts?

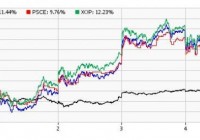
After a seven-month wild run, oil and energy stocks have bounced back strongly in recent sessions following the slew of capital spending cuts by several major players in the industry. This move, along with the latest data that a number of U.S. oil drilling rigs fell the most in 30 years last week, propelled the oil prices higher. In fact, both the crude and Brent surged about 20% in the four days till Tuesday, marking the longest winning streak since January 2009. However, oil price again reversed its four-session rally, dropping 8.7% yesterday after U.S. crude inventories jumped to a record high last week. Notably, crude is currently hovering around $50 per barrel while Brent is trading at over $55 per barrel. Spending Cuts at a Glance A large number of firms whether domestic or international have slashed their capital spending for this year in order to conserve cash balance for dividend payments. The second largest U.S. oil giant Chevron (NYSE: CVX ) trimmed its capital spending by 13% to $35 billion for this year while ConocoPhillips (NYSE: COP ) cut its spending by an additional 15% after reducing it 20% in December. Occidental Petroleum (NYSE: OXY ) reduced its capital spending by 33% to $5.8 billion for this year. European oil majors also followed suit. BP plc (NYSE: BP ) announced spending cuts by 20% to $20 billion for this year from the previous guidance of $25 billion. Royal Dutch Shell (NYSE: RDS.A ) plans to cut capital spending by $15 billion over the next three years while Total SA (NYSE: TOT ) trimmed its capital expenditure by 10% for this year. Further, the Chinese oil major CNOOC (NYSE: CEO ) slashed its capital spending by as much as 35% for this year and Russian oil major Gazprom ( OTCQX:GZPFY ) reduced it by $8 billion. Brazilian state-run energy giant Petroleo Brasileiro S.A. (NYSE: PBR ) or Petrobras also lowered its capital expenditure budget to $31-$33 billion from $44 billion. The efforts taken by these oil giants will likely curb oil production and reduce global supply, and thereby lead to higher oil prices. Market Impact Driven by a slew of investment cut plans, energy stocks and ETFs have made an impressive comeback and are easily crushing the overall market by wide margins over the past five days. In particular, SPDR S&P Oil & Gas Exploration & Production ETF (NYSEARCA: XOP ) , First Trust ISE-Revere Natural Gas Index Fund (NYSEARCA: FCG ) and PowerShares S&P SmallCap Energy Fund (NASDAQ: PSCE ) gained the most surging in double digits in the same period. Below we profile these ETFs in detail and discuss some of the specifics behind their recent rally: XOP This fund provides equal weight exposure to 83 firms by tracking the S&P Oil & Gas Exploration & Production Select Industry Index. Each holding makes up for less than 2.2% of the total assets. XOP is one of the largest and popular funds in the energy space with AUM of $1.9 billion and expense ratio of 0.35%. It trades in heavy volume of more than 10.4 million shares a day on average. FCG This fund offers exposure to the U.S. stocks that derive a substantial portion of their revenues from the exploration and production of natural gas. It follows the ISE-REVERE Natural Gas Index and holds 28 stocks in its basket that are well spread out across each component with none holding more than 6.05% of the assets. The fund has amassed $272.7 million in its asset base while charging 60 bps in annual fees. Volume is good with more than 942,000 shares exchanged per day on average. PSCE This fund provides exposure to the energy sector of the U.S. small cap segment by tracking the S&P Small Cap 600 Capped Energy Index. Holding 35 securities in its basket, it is concentrated on the top five firms that make up for 37.9% share. Other firms hold less than 5.4% of total assets. The fund is less popular and less liquid with AUM of $28.6 million and average daily volume of about 24,000 shares. Expense ratio came in at 0.29%. Other energy ETFs were also in deep green over the past five trading sessions. Some of these include IQ Global Oil Small Cap ETF (NYSEARCA: IOIL ) , First Trust Energy AlphaDEX (NYSEARCA: FXN ) , Market Vectors Unconventional Oil & Gas ETF (NYSEARCA: FRAK ) and PowerShares Dynamic Energy Exploration & Production ETF (NYSEARCA: PXE ) . All these are up in upper single digits. What’s In Store? The rally in the energy ETFs seems to be short lived as reduced investments will likely cut supply in the long term and short-term supply with remain intact. As per the latest EIA report, the U.S. crude stockpiles rose 6.3 million barrels in the week (ended January 30), much higher than the market expectation of a 3.7 million barrel increase. Total inventory came to 413.1 million barrels, representing the highest level in at least 80 years. The current threat facing the U.S. oil industry is the strike in the U.S. at nine refineries by the United Steelworkers union. This is the biggest strike since 1980 and will likely curtail crude processing adding to the supply glut. It could affect 10% of the U.S. refining capacity and if the strike turns to be a full-blown crisis, it could threaten about two-thirds of the total refining capacity, indicating more pain for the commodity and the energy stocks.

Best And Worst ETFs Of January

The year 2015 began on quite a volatile note and in fact saw the worst start to the New Year since 2008. Standard & Poor’s 500 index fell 3.1% in January while the Dow Jones Industrial Average lost 3.7% – marking its biggest monthly loss in a year. Concerns about the impact of a stronger dollar and lower oil prices on corporate earnings growth continued to bother investors. Moreover, global growth uncertainty also played foul with both the World Bank and International Monetary Fund having slashed their global growth forecasts. The three factors – oil, the strengthening U.S. dollar and lackluster global economic growth – worked in tandem pushing down corporate profitability for Q4 and the estimates for the current and subsequent quarters. Meanwhile, the Swiss National Bank dropped its long-standing exchange rate of the Swiss franc against the euro adding to the current market volatility. At the same time, the political situation in Greece worsened as the Syriza party won the country’s general elections, raising worries about Greece’s exit from the Euro zone. On the other hand, news that the U.S. consumer sentiment rose in January to its highest level in 11 years on better job and wage prospects and consumer spending in the fourth quarter expanded at the fastest pace since 2006 failed to bring in the much need relief to the U.S. markets. Adding to the woes, the U.S. economy expanded at a slower-than-expected pace of 2.6% during the final quarter of 2014. The pace signaled a slowdown in growth after an expansion of 5% in the third quarter and the 4.6% pace in the second. Given the huge market volatility, ultra-safe bond funds emerged as one of the biggest winners in January as investors rushed in for safety. Not surprisingly, some of the commodity and oil & gas ETFs emerged as losers shedding in the double digits. Best ETFs Volatility ETFs Volatility ETFs were the major gainers amid the ongoing turbulence, as these tend to outperform when markets are falling or fear levels are high for the future. The iPath S&P 500 VIX Short-Term Futures ETN (NYSEARCA: VXX ) has been leading the space with a 17% return in January, closely followed by 16.89% for the C-Tracks Citi Volatility Index ETN (NYSEARCA: CVOL ). VXX is the most popular volatility ETN on the market with an asset base of $937.7 million and average trading volume of 43.1 million shares. The fund tracks the S&P 500 VIX Short-Term Futures Index to provide exposure to a daily rolling long position in the first and second months of VIX futures contracts. The expense ratio came in at 0.89%. Bond ETFs Given the uncertainty in the global market, investors are flocking to safe haven long-term government bonds to protect their portfolio from losses. The PIMCO 25+ Year Zero Coupon U.S. Treasury Index ETF (NYSEARCA: ZROZ ), the Vanguard Extended Duration Treasury ETF (NYSEARCA: EDV ) and the iShares 20+ Year Treasury Bond ETF (NYSEARCA: TLT ) emerged as some of the biggest winners in this space gaining in excess of 9%. ZROZ tracks the BofA Merrill Lynch Long US Treasury Principal STRIPS index and holds 21 securities in its basket. The effective maturity and effective duration of the fund stand at 27.38 years. The fund manages an asset base of $164.2 million and charges 15 bps in annual fees. ZROV has a 30-day SEC yield of 2.30% and is up 16% quarter-to-date. iShares Residential Real Estate Capped ETF (NYSEARCA: REZ ) In the current ultra-low environment, investors in search of juicy yields are continuing to pile up real estate funds which offer attractive payouts. The fund follows the FTSE NAREIT All Residential Capped Index and provides exposure to 37 U.S. residential real estate stocks and real estate investment trusts (REITs). REZ manages an asset base of $347.2 million with a 30-day SEC yield of 3.18% and has returned 8% in the past one month. ETF Losers SPDR S&P Metals & Mining ETF (NYSEARCA: XME ) XME was the biggest loser last month dragged down by weakness within the broad commodity space. The fund lost 12.1% in January and is down 31% in the past one year. XME is the largest and most popular fund in the metals and mining space with an asset base of $370.6 million and is highly liquid with an average trading volume of 2 million shares. The fund tracks the S&P Metals & Mining Select Industry Index to provide exposure to a basket of 35 stocks. The ETF charges 35 basis points a year. SPDR S&P Oil & Gas Equip & Service (NYSEARCA: XES ) The persistent decline in oil prices over the past six months has taken a toll on the overall energy sector as well as on the growth prospects of a number of oil producers. XES tracks the S&P Oil & Gas Equipment & Services Select Industry Index providing exposure to a basket of 52 stocks. Sector-wise, Oil & Gas Equipment & Services occupies 72.3% of fund assets followed by 27.7% to Oil & Gas Drilling. The fund manages an asset base of $169.5 million and has lost 11.5% last month. The fund currently has a Zacks ETF Rank #5 or Sell rating. First Trust ISE-Revere Natural Gas Index Fund (NYSEARCA: FCG ) The fund offers exposure to the U.S. stocks that derive a substantial portion of their revenues from the exploration and production of natural gas. It follows the ISE-Revere Natural Gas Index and holds 28 stocks in its basket, which are well spread out across each component with none holding more than 7% of assets. The fund has gathered an AUM of $240 million so far and sees good average daily volume of over 1.3 million shares. The fund has shed 10.5% in January and currently has a Zacks ETF Rank #5 or Sell rating.

Lumber Is The Canary In The Homebuilders’ Coal Mine

Summary Lumber prices have historically tracked quite well with homebuilder stocks. Homebuilders have also recently surged past the S&P in recent months. With the deceleration in price gains still going on and Fed support quickly evaporating, there is nothing left to prop up this industry. While I have been generally skeptical of the supposed recovery in homebuilder stocks, I have limited my analysis to trends in home prices and the ability of the American consumer to handle a mortgage at current prices. For me, this analysis is sufficient to show that homebuilder stocks are in a pretty large bubble. In the following article, though, I plan to show the value of homebuilder stocks relative to lumber prices, which themselves are a good economic indicator, but also tend to follow the valuation of homebuilder stock. The Tight Relationship of Lumber and Homebuilders (click to enlarge) In the preceding chart, I have plotted the SPDR S&P Homebuilders ETF (NYSEARCA: XHB ) and spot lumber prices. A clear correlation emerges from before 2009 to around 2013. What we also see is that around 2013, while lumber prices crashed, homebuilder stocks continued onward, and more recently have even seen some gains. Generally lumber prices are thought to track the economy quite well. While many economic analysts have been bullish on the future of the US economy, commodity and bond markets have been showing for more than a year now signs of languish. A plot of corporate bond prices would show much the same thing as lumber prices in this graph, as they also have stalled starting around the beginning of 2014. More interestingly, other commodities have started to follow along in this weakening trend, with oil recently showing a spectacular fall and copper following along. Commodity markets are showing signs of warning about the future of the economy. Lumber especially has shown a historical tight relationship with the value of homebuilder stocks, and given what has happened over the past two years, we ought to be worried about the future prospects for share prices. The next plot that I have shown is the past 6 months of the relationship between lumber and XHB. (click to enlarge) What we see from this chart of the relative valuation of XHB to lumber prices is that they have traded in a relatively tight range. Starting in 2015, however, we notice a sharp spike upwards that was quickly corrected. Over the past few days this relative valuation has shot up again. Given the last swift correction in this ratio, we can probably expect homebuilders to go down in the near-term. The homebuilder rally seems to be losing steam, as the market reacted violently to this push above historical highs. Future Prospects for Timber (click to enlarge) In order to predict future movements in the price of wood, shown above is a graph of the iShares S&P Global Timber & Forestry Index Fund (NASDAQ: WOOD ). Chaikin Money Flow analysis shows strong price growth ending around the middle of September, interrupted by a strong selloff in October, corresponding quite nicely with the overall stock market. Interesting is that since then there was a brief rise in money flow, but even while this has slowed noticeably, the price appreciation has still continued. This seems like price gain without much support, and so even timber prices themselves may be unsustainable in the medium term. What is more worrying for timber prices is the state of the overall economy. Consistently low oil will likely result in slowed economic activity as oil exploration companies drastically reduce capex spending. With decreased capital spending, we can assume downward pressure on GDP growth, which is an ominous sign for timber, as well as for housing. Technical Analysis of XHB (click to enlarge) Technical analysis of XHB itself shows signs of weakness. At the end of November XHB reached a value of about 33.50, at which point momentum was lost and the stock began to fall. While XHB has been higher since then, it also has not been able to make any real progress. Volatility in XHB has drastically increased since that time, and perhaps a greater source of worry is the Chaikin Money Flow, which turned definitely negative throughout December and has not been solidly positive since then. The market seems to find the current valuation as high enough. Summary and Action to Take XHB has seen to lost momentum, as it has not been able to have a solid increase in value since the end of November. In addition, the trend of homebuilders with XHB is approaching historic highs, and this has been met with swift correction in XHB. The long term trend shows definite signs of worry, as lumber has not agreed with the high current valuation of XHB. Now would be a great time to sell any shares of XHB, as the stock is not likely to go any higher from here on. For a more speculative investment, shorting XHB would likely be a good idea. A long time horizon is probably needed for that trade to play out, though, as XHB has been able to keep this high relative valuation for more than a year now, and only time will tell how long it will be able to keep this up. In addition, if you want to play on the underlying weakness of the US economy, shorting the WOOD ETF may be the way to go. If GDP is unable to sustain itself, then timber prices will go down along with it. This is a very speculative move, however, since timber itself does not show signs of being overbought like the homebuilders. Still, timber is going to hurt if the economy slows. I still take shorting homebuilders as the safer option since not only will they fall if the economy stumbles, but they are also presently overvalued and due for a correction even if GDP does not change much. Disclosure: The author is short XHB. (More…) The author wrote this article themselves, and it expresses their own opinions. The author is not receiving compensation for it (other than from Seeking Alpha). The author has no business relationship with any company whose stock is mentioned in this article.