Tag Archives: industry

Short Idea: International Bank Of Azerbaijan Bonds

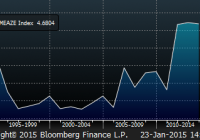
Summary Russia/Oil Derivative play with downgrade/war/financial/currency de-valuation pressure currently trading in the 90s. 93% of the economy tied to oil, 2015 budget based on $90 oil, in current conflict with Armenia, S&P outlook recently moved from stable to negative. International Bank of Azerbaijan has USD & Euro debt and local currency assets, high customer and industry concentrations and a Moscow subsidiary. (IBAZAZ is accessible via FNMIX , which is a 2.44% Holder Of IBAZAZ 5.625s Of ’19) For those who say Azerbaijan is not tied to Russia… Baku, Fineko/abc.az. The Central Bank of Azerbaijan says that US currency is in feverish demand in the country because of Russia . According to CBA, demand for US dollars increased in Azerbaijan starting from mid-December under the influence of psychological factors due to sudden depreciation of Russian currency. “To maintain stability of the national currency CBA set out $1.127 bn for sale. Before December 2014 the bank purchased $1.27 bn from the market and therefore, its net balance on currency exchange transactions was $0.143 bn last year”, – CBA says. Nevertheless, in December currency reserves of CBA reduced by $1.237 bn, which exceeded its expenses for maintaining stable rate of the national currency by $110.7 million. Azerbaijan and Oil Oil and gas production and exports are central to Azerbaijan’s economy. The country’s economy is heavily dependent on its energy exports, with more than 90% of total exports accounted for by oil and gas exports , according to data from the International Monetary Fund. Progress has so far been “elusive” for Azerbaijan in its efforts to diversify the economy away from a dependence on oil and gas, and it must press a fight against corruption to improve the business climate – International Monetary Fund Azerbaijan’s budget for 2015 is based on a price of $90 a barrel At $109 barrel oil last year Azerbaijan made significant investments in projects include the development of the Azeri-Chirag-Guneshli block of fields, Baku-Tbilisi-Ceyhan oil pipeline and the first stage of development of the Shah Deniz field. (U.S. Energy Information Administration) Azerbaijan’s main producing field, the ACG field, covers 167 square miles and is located 62 miles east of Baku in the Caspian Sea. Operators expected peak production to reach 1 million bbl/d, but production at this field so far failed to reach this target. Production problems have affected ACG output in the past couple years, with unexpected production declines occurring because of technical problems. (U.S. Energy Information Administration) But What About Azerbaijan’s Other Exports? Azerbaijan’s MP, member of the parliamentary committee on economic policy, Rufat Guliyev.: “Today, more than 70 percent of Azerbaijani non-oil products are exported to Russia, Ukraine, Kazakhstan ” But The Company (SOCAR) that Produces the Oil is Owned by the Government of Azerbaijan so They Will Support them, Right ? SOCAR only produces about 20% of the country’s oil output (U.S. Energy Information Administration) The remaining 80% of Azerbaijan’s output comes from the ACG oil fields by the BP-operated Azerbaijan International Operating Company (AIOC) and at the BP-operated Shah Deniz field (which produces oil condensate) AIOC is a consortium of 10 mostly non-Azerbaijani oil companies. (U.S. Energy Information Administration) Azerbaijan – Armenian Tensions = Possible War Update: January 26th: Azerbaijan violated the ceasefire about 800 times along the Line of Contact with Karabakh troops on January 24-25. Over 14,000 shots were fired towards Armenian military positions from guns of various calibers, grenade launchers and mortars, the press service of the Nagorno-Karabakh Defense Army reported. Conflict going on since 1994 Conflict became more serious in 2014 with significant casualties Ilham Aliyev – President of Azerbaijan; August 2014 via Twitter “We will restore our territorial integrity either by peaceful or military means . We are ready for both options.” “Just as we have beaten the Armenians on the political and economic fronts, we are able to defeat them on the battlefield “. Defense outlays will grow 27 percent to 3.8 billion manat ($4.8 billion), exceeding Armenia’s total budget spending of $3.2 billion, Finance Minister Samir Sharifov said in November 2014. On top of a budget already cut significantly due to huge drop in price of oil! (2015 budget based on $90 oil) Defense Spending back at peak levels – 1994 (when conflict started) Bloomberg Data What Happens if Azerbaijan un-pegs their currency to the USD? In June of 2013 the International Monetary Fund recommended Azerbaijan un-peg the Manat to the USD “Republic of Azerbaijan, Selected Issues” IMF Country Report: 13/165 The below table shows Azerbaijan is already on its way to a possible de-pegging of the Manat. (source: “Republic of Azerbaijan, Selected Issues” IMF Country Report: 13/165) THIS JUST HAPPENED IN TURKMENISTAN The Turkemenistan Manat has been rigidly pegged to the USD since 2009 at a rate of 1USD=2,85 MANAT Devalued by 18.6% in January of 2015 Kazakhstan had their currency pegged to the dollar as well…. In February of 2014 they unpegged their currency to the USD and devalued the currency by 19% Ok ok, What Does This Have to Do with The International Bank of Azerbaijan? The International Bank is being privatized and is only 50.65% owned by the government (as of 6/30/14 previously was 60.06% on 12/31/13) Considering that 90% of the country’s exports are oil & gas related it seems a bit strange that the financials list exposure to the industry as only 1.1% of total loans It is impossible to know how much of the loan portfolio is indirectly related to the industry 62% of IBA’s loan portfolio is related to Construction/RE development and Trade/Service industries IBA has a history of extending/renewing loans instead of marking them as past due/non-performing/impaired so we don’t truly know how many loans are in this category The bank has a $2.6B 6-12 month funding gap as of 6/30/14…bigger the gap bigger the risk (up from $2.3B at 12/31/13) IBA has ~$250M of foreign syndicated loans maturing in the first 4 months of 2015 (USD & EURO denominated) IBA has credit agreements with foreign banks which have ~$1.2B and ~EUR200M drawn down on them as of 6/30/2014 These term and revolving loans have various unknown financial covenants As of 6/30/14 the value of IBAs currency forward agreements were diminimus at ($1.1M) Concentration Risk 30 companies account for 42.5% of the total corporate loan portfolio Corporate loan portfolio is ~90% of total loan portfolio 20 Entities account for 93.7% of total guarantees as of 6/30/14 (guarantees total ~$1.6B as of 6/30/14) Moscow Subsidiary= International Bank of Azerbaijan-Moscow As reported in audited IFRS statements at year-end 2013, the bank’s aggregate exposure to the 23 largest customers amounted to 42% of total gross loans or 567% of its Tier 1 capital IBAM’s exposure to construction and real estate sectors stood at 189% of Tier 1 Capital at 12/31/2016 Time for the ISIS on the Cake Azerbaijani media: Embassy increases security in Baku because of ISIS threatening Only in January several articles about ISIS’s threatening to Azerbaijan appeared in international media outlets, and Baku has already taken up special measures related to the security of the leading countries and European state diplomacy, Azerbaijani information portal “Minval.az” reports, referring to the site “Axar.az.” The portal also notes that the European outlet “Another Western Dawn News” has recently published a sensational piece of news about the ISIS threat in Azerbaijan. It reported that Abdul Wahid Khudair Ahmad, the ISIL “Minister of Internal Affairs,” had called on the warriors from Azerbaijan to commence an armed struggle against the Western-backed Azerbaijani authorities. What could happen – Attack on BTC Pipeline Azerbaijan has 3 oil & gas pipelines/routes and 80% of Azerbaijan’s oil exports are done through the BTC pipeline , arguably the largest ISIS target in the country… (click to enlarge) (click to enlarge) (source: U.S. Energy information administration) Do I think it should be trading with a single digit yield in the 90s or even 80s given the above? Absolutely Not. (click to enlarge) (Source – Google Images) Disclosure: The author is short IBAZAZ. (More…) The author wrote this article themselves, and it expresses their own opinions. The author is not receiving compensation for it. The author has no business relationship with any company whose stock is mentioned in this article. Are you Bullish or Bearish on ? Bullish Bearish Neutral Results for ( ) Thanks for sharing your thoughts. Submit & View Results Skip to results » Share this article with a colleague

SolarCity – Why I’m Selling It And Buying First Solar

Summary SolarCity and First Solar stocks were highly correlated at the start of the fossil fuel price crash of 2014, but decoupled a few months ago. There may be an opportunity to hedge one stock against the other. SolarCity is highly speculative and will not make any profits for many years — if ever. First Solar is an established company with earnings. A pair trade could be a low-risk way to play FSLR and SCTY. Growth in solar energy has been tremendous and will almost surely be strong for the next several decades. According to seig.org (Solar Energy Industries Association): Today, the U.S. has an estimated 20 gigawatts [GW] of installed solar capacity nationwide, enough to effectively power nearly 4 million homes in the United States – or every single home in a state the size of Massachusetts or New Jersey – with another 20 GW in the pipeline for 2015 and 2016, according to SEIA and GTM Research projections. However, there have been major hiccups along the way including (but certainly not limited to) the whimsies of politics and fossil fuel prices. What if there was a way to invest in a solar stock that takes out the uncertainty of those hiccups and even the uncertainty of the overall market? There is a way. Last week I began a new mock portfolio here on Seeking Alpha: the Pairs Trade Portfolio; today I continue it with trades on SolarCity (NASDAQ: SCTY ) and First Solar (NASDAQ: FSLR ). A pair trade is a market-neutral hedge in which an investor essentially pits one company against another. Getting a return on a pair trade is not dependent upon a particular stock rising or falling necessarily, but dependent upon the relative price moves between two stocks (or other financial instruments). I won’t go into details about the hows and whys of pair trading here, as I have already described the theory in detail in a previous article. Please take a look at the link for more information on why pair trades might be a good investment. Correlation Since the start of the oil – and more importantly, natural gas – price crash, we can see from the chart below that First Solar and SolarCity stock prices had a high correlation for a few months before decoupling in early November as Solar City headed pretty much sideways while First Solar dipped substantially more. FSLR data by YCharts The change in correlation gives us our first clue that there might be an opportunity for a pair trade with these two stocks. Should SolarCity have outperformed First Solar? Time to dig a little deeper and see if we think FSLR is a relative bargain compared to SCTY. While the two companies are in the same industry and the stocks have had a high degree of correlation recently, the strategies of the companies could not be more different. SolarCity is pursuing fast growth financed by debt in the residential space while First Solar is a profitable vertically integrated manufacturer and utility-scale operator. Despite the differences in the companies, the macro events that often drive the stocks of most solar companies apply to both. The obvious recent example is the severe drop in fossil fuel prices, but there have been other factors in the past and there will undoubtedly be numerous factors in the future that affect both of these companies. Again, the pair trade largely insulates an investor from external macro events and focuses on one thing only: will one stock outperform the other? I think over the long haul First Solar will outperform SolarCity and below are some reasons. SolarCity: Show Me the Money When and how will SolarCity make money? That’s a big question for anyone interested in the stock and it is an impossible question to answer. At this point, the stock is pure speculation and the company is not expected to post a profit for many, many years. Well, how does one value the company then? SolarCity itself would like investors to focus on “retained value”. In a recent letter to shareholders a retained value number is prominently displayed as one of the highlights of the third quarter. In a presentation used in the third quarter conference call, the company had this slide to show: (click to enlarge) So what is retained value? SolarCity defines it as a discounted cash flow forecast from all megawatts booked as a contract. I won’t go into all of the assumptions that SolarCity makes to compute the retained value figure (much of which is unknown to the public), but I will hit some highlights. First, SolarCity assumes all contracts currently in place or booked to be installed will be renewed after 20 years. This is an outstanding assumption that is obviously flawed. 100% renewals will simply not happen, nor will all bookings even be installed. Second, the company assumes a discount rate of 6%. That is actually high at the moment, so one could argue that the retained value figure should, in fact, be higher than $2.2 billion. However, at some point rates will likely rise – perhaps substantially – and the 6% assumption could be far too low. Third, the company assumes that the technology will be current enough to warrant renewal for 10 years after the initial 20 year period. SolarCity states that the life expectancy of the equipment (not counting inverter replacement) used in its systems is “typically 30 years or more”. I’m going to go into that third point a bit more as I think it is particularly suspect. For one thing, solar panels degrade over time as the following shows: (click to enlarge) (Source: energyinformative.org ) Exact numbers over a long period of time are hard to come by since the vast majority of solar panels in existence have been installed quite recently. Based on my reading, I would estimate that the typical SolarCity customer could expect at least a 10% – 15% drop in power production at the end of 20 years. But more important is that the homeowner’s system will simply be obsolete in 20 years. Efficiency has increased dramatically in the last 20 years and will certainly continue to do so. I would not quite compare a 2015 solar system to using a computer from 1995…perhaps more like 2005. The hypothetical homeowner in 2035 is likely to be better off upgrading a system rather than renewing a lease on an outdated one. SolarCity wants investors to value the company based on this rather dubious metric of Retained Value. The simple fact that there are so many question marks around the computation makes me very nervous about it. Therefore, in my opinion, SolarCity’s retained value metric should be ignored and the company’s assumptions of future cash flows are highly speculative. The risks to the stock are huge. While shareholder’s in SCTY don’t seem to be too concerned about the present situation, let’s look at a more time-honored metric – current cash flow: SCTY Cash from Operations (NYSE: TTM) data by YCharts The above chart shows that the company has grown revenue at a rapid clip since going public but has also been burning through more and more money. Debt has increased substantially recently and will of course continue to do so for the foreseeable future. Right now SolarCity’s debt is financed at very low interest rates, but that could change over the next few years. And perhaps more importantly (and often overlooked by equity investors), it is debt holders that hold the reins to the company as pointed out in Barron’s : Founded in 2006, SolarCity has been consistently unprofitable. Most of its tax benefits and a portion of its future cash flows have been pledged to financing partners whose claims on the company are often senior to common shareholders’. If and when SolarCity begins to have positive cash flow, much of that money is pledged to go to the debt of the company. SolarCity received financing based upon its contract revenue and it has certain obligations to fulfill that exclude stockholders. First Solar: Oh, You Make Money? How Novel! Following up on the cash flow metric charted above, here’s a look at First Solar’s numbers: FSLR Cash from Operations ( TTM) data by YCharts First Solar is not exactly swimming in cash, but it has demonstrated a reasonable track record at generating some decent positive cash flow. In Q3 2014, the company posted an earnings per share of $0.87 and posted full-year guidance of $2.40 – $2.80. Based on 2015 analyst estimates of $4.52 per share, FSLR trades at a forward P/E of only 10.4. Conclusion SolarCity is certainly an interesting speculative play, but the key word there is “speculative”. Actually, the word “interesting” is somewhat key as well, as I prefer my investments to be as boring and predictable as possible. SolarCity is a wild card that may not come to fruition for decades, if ever. First Solar is clearly the lower risk play here. SolarCity is growing far faster, but is not making money doing so and might not ever make a profit. Here’s an interesting tidbit: in Q3 2014, SolarCity posted revenue of $58 million and First Solar posted revenue of $889 million — yet Solar City has a slightly higher market capitalization than First Solar. By going long FSLR and short SCTY, my strategy makes the viability of the solar industry as a whole a largely moot point. If the industry goes into the doldrums for the next 10 years it does not matter as long as FSLR outperforms SCTY. If the market tanks and takes these two stocks down to the single digits, it does not matter; as long as FSLR outperforms SCTY my trade will make money. The Portfolio I’m putting my fake money where my mouth is and buying FSLR and shorting SCTY in my Seeking Alpha portfolio as of about 1:20 pm Eastern Time on Feb 9. Here is what the mock portfolio looks like so far after one week (note that I plan on adjusting, adding, and updating this for years): (click to enlarge) Not much of note yet, but there will be more to come. Be sure to click “follow” if you would like to get real-time alerts on my future articles. Disclosure: The author has no positions in any stocks mentioned, and no plans to initiate any positions within the next 72 hours. (More…) The author wrote this article themselves, and it expresses their own opinions. The author is not receiving compensation for it (other than from Seeking Alpha). The author has no business relationship with any company whose stock is mentioned in this article.

Sell Your Employer, Get VTI Instead

Summary Many employees hold stock in the company that employs them. Taking advantage of plans that offer a discount on stock makes sense, but don’t let it overwhelm your portfolio. By not rebalancing frequently enough, employees may find themselves with diversifiable risk. The excess risk provides no excess (expected) return, and the risk isn’t just having too much of one company in your portfolio. I’m suggesting investors take a better look at replacing their employer’s stock with VTI whenever the option is available. The last week I’ve been doing a great deal of research on behavioral finance. There are several potential pitfalls for investors to avoid, but most investors are not familiar with behavior finance. I’ll be highlighting several of those pitfalls so readers can watch out for them. My focus in this article is why the Vanguard Total Stock Market ETF (NYSEARCA: VTI ) is a better investment than your employer. I can’t say that VTI will provide better returns, but I am confident that the expected return for the level of risk will be superior. Two problems with owning your employer: Problem #1 The first problem should be fairly clear to most investors. Holding individual companies is a fine way to invest, but it creates a substantial amount of diversifiable risk if individual companies are a large part of the portfolio or if multiple companies within the same industry are being selected. When the position in the employer reaches higher levels, say 10 or 15%, it becomes a substantial risk factor for the portfolio. Two problems with owning your employer: Problem #2 The second problem is one that many intelligent people manage to completely overlook. The second risk factor is that you are exposing the value of your portfolio to the same risk factors that are impacting the value of your lifetime earnings. Let’s start with an extreme example: Enron Long-term employees had ample opportunity to build up substantial positions in the company stock. When a company goes out of business, the employees are facing unemployment. If they also held the stock, they risk seeing the value of their portfolio decline substantially. If the firm employs a substantial number of people with their skill set within the geographic area, several former employees may be faced with needing to move in order to find new work. The concentration of that skill set exceeding the number of available positions makes it an unfortunate situation that is even more significant for employees that own their home and will be facing transaction costs on selling the house. Industry risk On top of the company-specific risk, there is also a level of industry risk. If the company is closing locations because the industry is less profitable, finding a job with a competitor will be more difficult. It would be preferable for the employee to have less than normal exposure to his industry within his portfolio. Whether the firm is in biotech or car manufacturing, the price that the employee’s skill set can command in the free market is still dependent upon supply and demand within the industry. Solving the problem There are two ways to solve this problem. An investor can either attempt to build a diversified portfolio that intentionally has less than normal allocation to their industry. However, I think it is much simpler and more cost efficient, due to trading commissions, to simply buy the Vanguard Total Stock Market ETF. I’ve heard people lately talking about how the stock market is being valued too highly. I think some of those analysts raise very legitimate concerns. However, I also believe that market timing has a negative expected value. Attempting to find the right time to jump in may be viable for individual companies, but trying to find the right time for buying the entire market is another challenge entirely. When was the right time to buy? In my opinion, several decades ago would have been great. Since that isn’t an option, I favor investing in the total market at the present time. Is this the perfect moment? I doubt the timing is perfect. Whichever day you buy into the market, there may well be a day in the future that offers a lower price. Buying into the market and having the value never dip under the entry price has more to do with being lucky than good. How I’m doing it Over the next couple months, I’ll be overhauling my positions. The vast majority of my positions are in tax advantaged accounts, so I’m not concerned about the ramifications of capital gains. I’ll do the rebalancing as soon as I finish with filing taxes for 2014. I need to know how I’m going to split up my contributions to Traditional and Roth IRA accounts. I don’t know if the market will move up or down during that time, but I expect VTI to be trading right about NAV due to the enormous trading volume. For investors not familiar with VTI, the average is over 3 million shares per day. I’ll buy at whatever the price happens to be at the time, and I’ll be investing over half of my total investment portfolio. Why VTI? When I started looking at ETFs for my portfolio, I started looking at SPDR S&P 500 Trust ETF (NYSEARCA: SPY ). I started running historical numbers comparing the volatility of portfolios that included ETFs with exposure to several investing factors. I included emerging markets, precious metals, bonds, and bonds in other currencies. What I found was that it was possible (historically) for an investor to find better returns and lower risk through a global portfolio. However, the returns did not take into account any trading costs and the difference was not very substantial. After seeing how well SPY was able to do against the much more complicated portfolios, I decided it would be better to try to replicate it. VTI offers extremely high correlation to SPY, which isn’t surprising given how many of the same equities are being held. However, VTI is offering exposure to smaller cap companies without having such a large position that it would substantially alter the returns. The result is an ETF that offers extremely similar performance to SPY with a slightly lower expense ratio. For VTI it is .05%, for SPY it is .09%. Conclusion If an investor is holding stock in their employer, it would be prudent to consider swapping the position for VTI or SPY. If the position is required as part of a program that allows employees to buy the company stock at a discount to the market price, it may be reasonable to retain the amount of stock required by the program. For any excess cash being invested, VTI or SPY offers dramatically lower risk for the investor’s life. The risk is not simply the standard deviation of the portfolio value. Investors need to be aware that holding their employer exposes their portfolio to precisely the same risks that their career is facing. That is a risk that all investors should seek to diversify. Disclosure: The author has no positions in any stocks mentioned, and no plans to initiate any positions within the next 72 hours. (More…) The author wrote this article themselves, and it expresses their own opinions. The author is not receiving compensation for it (other than from Seeking Alpha). The author has no business relationship with any company whose stock is mentioned in this article. Additional disclosure: Information in this article represents the opinion of the analyst. All statements are represented as opinions, rather than facts, and should not be construed as advice to buy or sell a security. Ratings of “outperform” and “underperform” reflect the analyst’s estimation of a divergence between the market value for a security and the price that would be appropriate given the potential for risks and returns relative to other securities. The analyst does not know your particular objectives for returns or constraints upon investing. All investors are encouraged to do their own research before making any investment decision. Information is regularly obtained from Yahoo Finance, Google Finance, and SEC Database. If Yahoo, Google, or the SEC database contained faulty or old information it could be incorporated into my analysis. The analyst holds a diversified portfolio including mutual funds or index funds which may include a small long exposure to the stock.