Tag Archives: income

How To Hunt For Deep Value Stocks With Bravery Over Patience
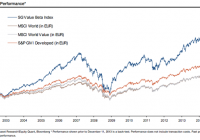
Everyone loves a bargain but choosing a strategy for finding mispriced shares isn’t as simple as it seems. Eighty years after Ben Graham and David Dodd laid the groundwork for what’s known as value investing , some of the brightest minds in finance are still working on the best ways of capturing deep value. Given that research has long shown that cheap beats expensive over the long run, honing a value strategy is clearly worth exploring. So where do you start? When Graham and Dodd wrote Security Analysis in 1934, they changed the rules on how investors should think about stocks. Chastened by catastrophic stock market losses a few years earlier, they urged investors to stop chasing expensive “glamor” and obsessing about earnings growth. Instead, they showed that it was mispriced and undervalued stocks that offered the best chance of outperformance. Ever since, investors have deployed an armory of metrics to help them find shares that don’t reflect the expected value of the companies behind them. Usually, they compare a company’s share price against what it earns — such as the price to earnings ratio — or against what it owns — such as the price to book ratio . One value ratio is never enough When it comes to these value ratios, investors often stick to their favourites. Just take a look at the the guru strategies we track at Stockopedia — many of them use just one valuation metric. But others think it’s too simplistic to use a single ratio to find and compare value stocks. In 2014 the equity research team at investment bank Societe Generale tackled this head on. Led by quant strategist Andrew Lapthorne, they’d already been tracking one value strategy called Quality Income . As the name suggests, it looks for good quality, dividend paying companies. But the focus on relatively high dividend yield is also a signpost to shares that might be cheaply priced. Quality Income was devised for what SocGen call “patient” value investors. These are the ones who are happy to let dividends compound over time in return for less volatility than you see in other types of value strategies. But Quality Income doesn’t get its hands dirty with another major source of value in the market. This is the one that most of us think of when it comes to deep value — buying beaten up, distressed, unloved and ignored stocks. Some of these laggards will never recover but others will bounce back and then some. So SocGen created an alternative strategy for the “brave” investor. Rather than rely on one single ratio, it combines five well known value factors to find stocks that are cheap relative to their sectors. Bravery is needed because these could well be companies with problems. And that means there can be sharp initial losses before the value in them eventually “outs.” The factors include: Book to Price Earnings to Price One Year forward Earnings to Price EBITDA to Enterprise Value Free Cash Flow to Price In 2014, its SG Value Beta index of the 200 cheapest companies globally returned 18.7%, which was broadly in line with other value-based indices. Since 2002, based mainly on back testing, it has consistently outperformed those benchmarks. (click to enlarge) Screening for “brave” deep value stocks Of course on reading the research it became very clear to us that the SocGen team had chosen a strikingly similar set of value ratios to Stockopedia.com’s own ValueRank — with which we already score over 18,000 European and US Stocks. Out in the cold… It’s pretty clear which sectors are currently out in the cold. Oil & gas producers like Ophir Energy ( OTC:OPHRY ) and oilfield services businesses like Petrofac ( OTCPK:POFCY ) and Hunting ( OTCPK:HNTIY ) have been beaten down of late. Likewise, there is a handful of industrials like Serco ( OTCPK:SECCY ), which slumped after issuing a series of profit warnings last year. Troubled cyclicals like pub groups Punch Taverns ( OTCPK:PCTVD ) and Enterprise Inns ( OTCPK:ETINY ) make the list, as does retailer Debenhams ( OTCPK:DBHSY ). Interestingly Debenhams had a ValueRank of 94 back in October 2014, but a gradual edging up in price has trimmed that back to 90. Financial stocks also feature heavily, with Standard Chartered ( OTCPK:SCBFF ) easily the largest by market cap. TSB Banking ( OTCPK:TSBBY ) is also there, as are insurance groups Friends Life ( OTC:RSLLF ) and Phoenix ( OTC:IPHXF ). Name Mkt Cap £m Value Rank Sector Standard Chartered 22,625 93 Financials Petrofac 2,627 91 Energy Phoenix 1,884 97 Financials Indivior 1,276 95 Healthcare Vedanta Resources 1,212 94 Basic Materials Serco 942.5 90 Industrials Debenhams 933.4 90 Consumer Cyclicals MHP SA 637.5 96 Consumer Defensives Deep Value is not for the faint hearted… It’s important to remember that digging around among the cheapest stocks in the market isn’t for the faint hearted. Often these companies come with uncertainty surrounding their financial strength or business viability. It was for that reason that Graham and Dodd encouraged wide diversification — a portfolio approach should harvest the deep value premium and absorb the inevitable losses. In the decades since they introduced the concept of buying undervalued stocks, numerous financial ratios have been used as a measure of what’s cheap. But rather than relying on a single measure, a value composite using several of those value factors is proving to be an effective way of navigating one of the trickiest parts of the market. Editor’s Note: This article discusses one or more securities that do not trade on a major exchange. Please be aware of the risks associated with these stocks.

Southern Company – Expect A Dividend Increase, But Not Much More

Recently the Southern Company announced fourth quarter earnings results. The company had higher revenues, income and earnings –- slightly offset by a larger share count. Expect a dividend increase in the next quarter, but perhaps not much more as an intermediate-term investment. Recently the Southern Company (NYSE: SO ) released fourth quarter and full year earnings results. Here’s a look at how 2014 compared to 2013: 2014 2013 % Change Revenue ($b) $18.50 $17.09 8.3% Net Income ($b) $1.98 $1.64 20.4% Basic EPS $2.21 $1.88 17.6% Basic EPS Excl Items $2.80 $2.71 3.3% Dividend/Share $2.08 $2.01 3.5% Shares Outstanding (-m) 906.0 885.0 2.4% As you can see above, Southern Company posted higher sales, income and earnings as compared to the previous year. Note that the earnings increase was offset slightly by the increase in common shares outstanding, as is typical with utility companies. Additionally, the company was able to increase its dividend for the 13th straight year. Earlier last month the company announced a $0.525 quarterly dividend , payable March 6th, which marks the 4th payout at this rate and 269th consecutive payment overall. Southern Company President and CEO Thomas Fanning said that the company had one of its “best years ever” as weather conditions were “closer-to-normal.” Adjusted earnings were quite a bit higher than basic earnings in both years due to increased cost estimates for the construction of the company’s Mississippi Power Kemper project. During 2013 these after-tax charges amounted to 83 cents per share, while they represented a 59-cent drag in 2014. In a previous article I indicated that, while utilities have had strong returns recently, it’s probably not prudent to expect this moving forward. The Southern Company was a prototypical example of this, having generated 14% yearly total returns over the past half decade. Today the company has a “current” yield around 4.1% — which would be expected to increase next quarter — and a trailing earnings multiple in the 18 to 23 range depending on whether you look at adjusted or basic earnings. This compares to a “normal” multiple closer to 16 or so. Analysts are expecting intermediate earnings growth around 3% per annum . Taken collectively, this could translate to 5% anticipated annual total returns — effectively matching the dividends received without much expected capital appreciation. Of course the company could grow faster or trade at a higher multiple in the future, but these might not be altogether prudent expectations given its history. The Southern Company remains a solid income-producing security, but perhaps not as compelling as it has previously been. Disclosure: The author is long SO. (More…) The author wrote this article themselves, and it expresses their own opinions. The author is not receiving compensation for it (other than from Seeking Alpha). The author has no business relationship with any company whose stock is mentioned in this article. Are you Bullish or Bearish on ? Bullish Bearish Neutral Results for ( ) Thanks for sharing your thoughts. Submit & View Results Skip to results » Share this article with a colleague

Franklin Universal Trust: An Interesting Mix In This CEF

Summary FT’s goal is current income and capital preservation. FT takes a unique approach to that, mixing risky assets with more stable ones. It’s not a fund I’d rush to own, but it could have a place with the right investor. Franklin Universal Trust (NYSE: FT ) is an odd beast in some ways and yet logically built in other ways. At the end of the day, however, if you are buying it as a long-term investor you need to understand that it’s playing in two allocation sectors and that may not fit well within your broader portfolio. What it does Franklin Universal Trust’s primary objective is income and preservation of capital. Its secondary objective is growth of income. That said, it has a funny way of going about reaching these three goals since it invests in a combination of high-yield bonds and utility stocks. The split is around two-thirds bonds and one-third utilities. There are some other things in the mix, like preferred shares and resource stocks, but they are relatively minor positions. FT also makes use of leverage to enhance performance. According to the Closed-End Fund Association , leverage recently stood at around 23% of assets. Essentially, FT is mixing a relatively conservative investment category, utilities, with a riskier one, junk bonds. That’s not an outlandish proposition at all, but it makes this fund something of a difficult fit if you have your own portfolio allocation goals. For example, you’ll need to go down another level, looking at the fund’s portfolio allocations, to truly ensure your portfolio weightings are what you want them to be if you own FT. That wouldn’t be needed for pure-play offerings. There’s not much information available about what the fund actually does to pick its stocks and bonds, except that it uses fundamental research on the bond side and looks for attractive dividend yields and a history of dividend increases in the utility space. That’s not much to work with if you want to really understand what your managers are doing. In fact, it’s utility portfolio is comprised of some of the largest and best-known utilities in the country, a portfolio which you could arguably create yourself if you wanted to. How’s it done? Because of the odd mix of assets, it’s kind of hard to benchmark this fund. That said, it’s 10-year trailing annualized return through January comes in at about 8.5% according to Morningstar (this figure includes dividend reinvestment). That ranks in the top percentile of Morningstar’s “Tactical Allocation” category, but I’m not sure that’s exactly the right place to put this fund-though, to be fair, I have no better suggestion as to where it belongs. For comparison, Vanguard 500 Index Fund (MUTF: VFINX ) turned in a trailing 10 year return of just under 8% annualized. It’s standard deviation over the trailing ten year period was around 13. That’s not much lower than the S&P 500 Index, so FT isn’t exactly a low volatility offering. To bring that point home even more keenly, the standard deviation of Vanguard High-Yield Corporate Fund (MUTF: VWEHX ) over that span was around 9 and Vanguard Utilities Index Fund’s (MUTF: VUIAX ) was about 13. These two funds produced annualized returns of around 6.5% and 9.5%, respectively, over the trailing ten years. So in some ways FT is getting a higher return than you might achieve in other investments, including pure play high-yield funds and an S&P 500 Index fund, but it’s taking on more risk to do it-though not quite as much as an S&P 500 Index fund. And it’s worth noting that the fund’s net asset value, or NAV, fell nearly 37% in 2008. It’s share price fell nearly 41%. Clearly that was a disastrous year for investing, but it’s a real-world reminder that mixing high-yield with utilities isn’t going to save you from market volatility. To be fair, the NAV rose nearly 55% in 2009 (the share price advanced 70%), so what went down hard came back with a vengeance. You just have to be prepared for that kind of price movement should the market get volatile again. And, overall, don’t expect the fund to be a low risk offering. It isn’t. The fund’s distribution, meanwhile, has been fairly steady year in and year out. The current yield is around 6.6%. That’s nothing to write home about but it is an achievable distribution that has allowed for the NAV to increase from $5.85 a share in August of 2010 to a recent figure of around $8.15. And all of its distributions of late have been funded with dividend income, interest, and capital gains. So, as far as it goes, it appears to have lived up to its income objective, though not so much the income growth goal. Expenses are a tad high, but that’s largely related to the fund’s use of leverage. In fact, according to the Closed-End Fund Association, the management fee is less than 1% of assets, which is pretty reasonable. However, total expenses come in at close to 2% and have been as high as 2.6% in recent years. The cost of leverage adds a lot to this relatively small fund’s expenses. You gotta know what you own At the end of the day, FT is an unusual combination of investments, similar in some ways to Cohen & Steers REIT and Preferred Income Fund (NYSE: RNP ) another closed-end fund I’ve reviewed that invests in both real estate investment trusts and preferred shares. If you are trying to build a portfolio based on an asset allocation model, FT and RNP probably aren’t the right fund for you. You’ll have to dig into their portfolios to make sure you don’t over- or under-weight key asset classes. You’d likely be better off just buying pure play funds to keep your life simple That said, if you are looking for a decent fund with a solid yield, RF isn’t a bad option. It’s done reasonably well over time, though not spectacularly, while paying a consistent distribution. That’s hard to argue with, as long as you understand that you’re buying an odd hybrid fund. Disclosure: The author has no positions in any stocks mentioned, and no plans to initiate any positions within the next 72 hours. (More…) The author wrote this article themselves, and it expresses their own opinions. The author is not receiving compensation for it (other than from Seeking Alpha). The author has no business relationship with any company whose stock is mentioned in this article.