Tag Archives: income

Russian Bears, Ukrainian Beets, Battlestar Novorossiya

Two events are driving the global economy: the Russo-Ukrainian war and the collapse of oil. Both the EU and the Russian Federation want to maintain the global economic status quo at the expense of Ukrainian territorial loss. Portfolios should be robust to continued expansion as well as black swan events. Many of the naysayers of the new year 2015 are being proven wrong: there has been no significant market correction in U.S. equities – as Bill Gross of Janus Capital and others had foreseen for 2015 – and Europe is showing signs of slow growth, despite numerous bears claiming the opposite. Timing is notoriously difficult and self-fulfilling with doomsday prophecies. I argue that there are two factors that any portfolio must be robust to, and each of these possesses its own positive or negative drag on the global economic environment: Russia and oil. Vladimir Putin of Russia could start World War III within seconds if he so desired, but he knows the country’s economy simply isn’t ready. Russia’s activity in Eastern Ukraine and the Crimean peninsula has in one year established a new norm in geopolitics: an ebb and flow between Russian aggression and Western appeasement, both of which are understandable from each side’s perspective. President Putin will not accept a loss in Eastern Ukraine because it is antithetical to his ideology that Russia is both under attack from the West and simultaneously superior to it . In comparison, Francois Hollande of France and Angela Merkel of Germany know that any escalation of the Russo-Ukrainian conflict could trigger open war and disrupt the EU’s fledgling recovery – German GDP rose 0.7% in the 4th quarter , after growing 0.1% in the previous 3 months. There is little confidence on Wall Street that the Minsk II agreements signed on February 11th will lead to prolonged peace, as the DJIA surged 72 points after the Minsk Protocol in September 2014 and decreased by 3 points after Minsk II and the German GDP surprise. The other looming fundamental driver is the price of oil. The market seems to lag when oil falls and prosper when oil increases. After flirting with the technically significant price of $43 per barrel, oil markets rallied on substantial CapEx cuts in the industry. However, there is no surety that oil will not plunge into the $30s this year. As Tom Kloza of Oil Price Information iterates , oil prices will bottom in Q2 corresponding with “one of the expirations of the WTI contracts.” The International Energy Agency explained that “ample supplies will raise global inventories before investment cuts begin to significantly dent production.” Combined with the astronomical impact of low oil prices on Russia’s budget, there is reason to suspect that the US is saving oil manipulation as a last economic tactic against further Russian aggression. The question is, which black swan event will happen first – open war in Ukraine or a collapse in oil? U.S. bond and equity markets are rallying despite mediocre economic fundamentals, because the U.S. is the only place to invest globally. Not that the U.S. is a powerhouse of growth and prosperity – it is, relatively, the only space where investors can earn better-than-index returns with a reasonable amount of risk. US Treasury yields are at record lows, because the dollar is strong and the U.S. Treasury is the only entity in the world that investors still believe has zero default probability. U.S. equities continue to trade at unusually high levels for two reasons: first, capital has poured into U.S. equities in search of higher returns in the low interest rate environment, fueling a sustained rally in the stock market (barring the “correction that wasn’t” that took place in October 2014); second, U.S. companies are taking advantage of low interest rates to lever returns at debt ratios not seen since before the collapse in 2008. A collapse in oil could be the catalyst that brings the U.S. equity market down to earth, especially given the heavy interdependencies between Western and Russian corporations. As long as the status quo remains the same and a black swan event doesn’t occur, this bubble may actually last and transition into a normal economic growth cycle. But that’s the catch – can the status quo be maintained? Expect Russian aggression and a collapse in oil to be inevitably linked. If one happens, so will the other. In this scenario, a portfolio overweight with U.S. treasuries and municipal bonds is ideal, with significant cash on hand to buy U.S. equities in the oil space on the dip. The status quo survives if Eastern Ukraine turns into a frozen conflict on the likes of Transnistria and Abkhazia as the U.S. and eurozone transition out of recovery into expansion. In this case, a portfolio overweight in cyclicals is ideal. Each scenario seems equally likely, so a risk-parity portfolio robust to both cases might be the best option. Unfortunately, neither the Ukrainians nor the Russians appear willing to concede territory at any cost, so look here to history for the consequences of inaction. Appealing to the words of Winston Churchill, “An appeaser is one who feeds a crocodile, hoping it will eat him last.” Disclosure: The author has no positions in any stocks mentioned, and no plans to initiate any positions within the next 72 hours. (More…) The author wrote this article themselves, and it expresses their own opinions. The author is not receiving compensation for it (other than from Seeking Alpha). The author has no business relationship with any company whose stock is mentioned in this article.
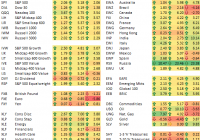
Key ETF Performance Through President’s Day 2015

Below is a look at the performance of various asset classes through President’s Day 2015 using key ETFs from our daily ETF Trends report available to Bespoke Premium members. For each ETF, we show its performance last week, so far in February, and so far in 2015. US-related ETFs are generally on the left side of the matrix, while international, commodity and fixed income ETFs are on the right side of the matrix. US equities are up sharply so far in February, which has allowed them to erase January losses and move into the green for the year. The S&P 500 (NYSEARCA: SPY ) and Dow 30 (NYSEARCA: DIA ) ETFs are both up more than 5% in February, while the Nasdaq 100 (NASDAQ: QQQ ) is up 5.75%. Largecaps and midcaps are outperforming smallcaps year-to-date, while growth is outperforming value. Looking at the ten sectors, Energy (NYSEARCA: XLE ), Materials (NYSEARCA: XLB ), Telecom (NYSEARCA: IYZ ) and Consumer Discretionary (NYSEARCA: XLY ) are all up 7%+ this month already. On the flip side, the Utilities (NYSEARCA: XLU ) sector has plummeted this month, leaving it down more than 4% on the year. Outside of the US, most countries are in the green for the year, with the exception of Brazil (NYSEARCA: EWZ ), Canada (NYSEARCA: EWC ), Mexico (NYSEARCA: EWW ) and Spain (NYSEARCA: EWP ). The Russia ETF (NYSEARCA: RSX ) is up the most of any ETF in the matrix with a year-to-date gain of 23.38%. Commodities have been all over the place this year. Oil (NYSEARCA: USO ) is up 10% in February, but it’s still down 3.63% year-to-date. Gold (NYSEARCA: GLD ) is down 4.43% in February, but it’s up 3.87% YTD. Finally, fixed income ETFs have run into a rough patch over the last couple of weeks, especially the 20+Yr Treasury (NYSEARCA: TLT ) with a decline of 7.3% on the month. Even after the pullback, though, fixed income ETFs remain in the green on the year. Are you Bullish or Bearish on ? Bullish Bearish Neutral Results for ( ) Thanks for sharing your thoughts. Submit & View Results Skip to results » Share this article with a colleague

Do The Changes In Supply For Silver Impact SLV?

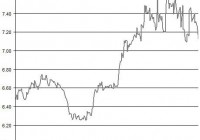
Summary The price of SLV remained flat in the past several weeks. Let’s examine the changes in the supply for silver and its relation to SLV. The recent news from Greece could also play in favor of SLV. The recovery of the iShares Silver Trust ETF (NYSEARCA: SLV ) came to a halt in recent weeks as its price remained around $16 during most of February. Do the expected changes in the supply for silver likely to impact the price of SLV in the near term? Also, how do the latest market developments play out for SLV? Even though the SPDR Gold Trust ETF (NYSEARCA: GLD ) has outperformed SLV during the past year, the ratio between the two remained in the 7.2-7.6 range in recent weeks. The relation between the two tends to be strong and positive. Source of data: Google Finance If the price of GLD were to resume its rally, this could also start to push back up SLV. Besides the changes in the demand for silver and gold for investment purposes, let’s review the expected changes in the supply for silver. Does silver supply matter? One issue that continues to resurface is around the changes on the supply side of silver. In the past few years, the silver production has picked up. In 2012 , production reached 792 million oz; in 2013, output was 819.6 million oz; and for last year , current estimates for the silver production were around 868 million oz – nearly 6% gain year over year. This year, however, HSBC (NYSE: HSBC ) projects silver production to slip to 850 million oz, which represents a 2% fall compared to 2014. After all, some silver producers such as Pan American Silver (NASDAQ: PAAS ) have higher all-in sustaining costs than the price of silver. This is likely to force such companies to slow down their production or, at the very least, slash capex for future growth. Further, silver scrap, which accounted for nearly 16% of total supply back in 2013, is also expected to come down in 2015 compared to the previous year. Will these developments be enough to push back up the price of SLV? As I pointed out in the past, the changes in the physical world of silver have a secondary role in the actual price of SLV. Don’t get me wrong. The sudden drop in supply of silver could push up SLV prices. But the big mover for SLV will remain the changes in the demand on paper for silver. Since silver has industrial use and also investment use, a drop in supply of silver doesn’t have a strong impact on the latter, only the former. If changes in physical demand and supply of silver had a strong impact on SLV prices, then we should have seen a much better match between the changes in supply/demand and prices. Case in point, back in 2012, the physical demand for silver was 954.4 million oz – this was well below the supply for silver. Then in 2013, the physical demand was higher than the supply. But silver prices only came down in 2013 compared to 2012. Moreover, it’s hard to consider the changes in supply/demand for silver as the driving force behind the price of SLV back in 2008-2011 when in fact the global economy only cooled down the demand for silver for industrial fabrication. Looking forward, the World Bank still expects the price of silver to remain around $18 in the coming years. But this outlook could change especially if the U.S. dollar resumes its rally and if the interest rates in the U.S. pick up again. The upcoming release of the minutes of the FOMC meeting from last month may provide some additional insight behind the latest meeting and shed some light on the FOMC’s next move vis-à-vis its rate hike. The recent economic reports in the U.S. were mostly positive, including the non-farm payroll and JOLTS reports. They have increased the odds the market gives for the FOMC to raise rates in the middle of the year. Also, the U.S. dollar didn’t do much in recent weeks against the yen. The linear correlation between SLV and U.S. dollar/yen was mid-strong at -0.51 during the past month. Source of data: Bloomberg If the U.S. dollar were to resume its rally, this could have a negative impact on the price of SLV, or at the very least curb down the rise in SLV. The Greek debt The ongoing debt problems of Greece could still play in favor of precious metals, including SLV. It’s unclear when the Greeks will run out of money, but it’s not going to last long (some estimated it could be as soon as March ). Despite the little progress achieved last week in the Euro group meetings, a possibility of a Greek exit remain low, for now. This week, the second round of Euro group meetings will take place. Greece will look toward a reduction in debt, extend debt maturities and a lower fiscal surplus than the 4.5% mandated from next year. The state elections in Hamburg , Germany, ended and now that they are behind Merkel, the Germans might be more open to reach a compromise with Greece. But as long as the uncertainty in the markets remains high and a possible Greek exit is still in a possibility, the demand for investments such as SLV is likely to rise. The expected fall in the supply for silver is likely to have a minor role in the progress of SLV. The changes in demand for silver for investment purposes will remain the main driving force behind SLV. For now, the uncertainty in Europe could play in favor of SLV. But if the U.S. dollar were to start rising again, and if the interest rates in the U.S. also pick up, these factors could push back down SLV. For more see: Will Higher Physical Demand for Silver Drive Up SLV? Disclosure: The author has no positions in any stocks mentioned, and no plans to initiate any positions within the next 72 hours. (More…) The author wrote this article themselves, and it expresses their own opinions. The author is not receiving compensation for it (other than from Seeking Alpha). The author has no business relationship with any company whose stock is mentioned in this article.