Tag Archives: income

Dominion Resources Is Boosting Returns To Shareholders, But Is It A Buy?
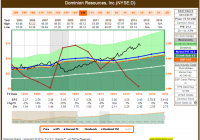
The utility sector is generally known as a collection of high yield, slow growth companies. Dominion Resources has been a top performer in the sector with an attractive growth rate and dividend yield. Dominion Resources recently announced a boost to the dividend and guided for a higher payout ratio going forward. This article will discuss the current valuation levels for the company and determine if it is worth adding to my dividend growth portfolio. As an avid reader of the dividend growth investing strategy on Seeking Alpha, it’s apparent that many investors using this method have a fond appreciation for utility companies in their portfolios. The consistency of earnings and reliable nature of a long-term, slow and steady growth rate make these companies a great cornerstone for long-term buy and hold investors. One utility that is a great example of this slow and steady growth is Dominion Resources (NYSE: D ). Here is the company description from Dominion’s website: Dominion is one of the nation’s largest producers and transporters of energy, with a portfolio of approximately 24,600 megawatts of generation, 12,400 miles of natural gas transmission, gathering and storage pipeline and 6,455 miles of electric transmission lines. Dominion operates one of the nation’s largest natural gas storage systems with 949 billion cubic feet of storage capacity and serves utility and retail energy customers in 12 states. Dominion has a long history of providing outstanding total returns for investors. The company has a 10-year dividend growth rate of 6.3%, a 10-year earnings growth rate of 4.5%, and during that time has provided investors with 12.4% annual total returns with dividends reinvested. While the past has been great, the future may be even better. On February 9th, the company announced an 8% increase in the quarterly dividend from $0.60 to $0.6475 per share, and stated its intentions to increase the dividend payout ratio from a range of 65-70% of earnings to 70-75% through the end of the decade. Dominion also held its Investor and Analyst Meeting on February 9th, with management providing an overview of operations and expectations for the future. During this meeting presentation, management provided guidance for 6-7% earnings growth and 8% dividend growth through 2020, both of which exceed rates seen over the last decade. With a current yield of around 3.55%, investors buying for the long term can lock in an attractive yield growing at a high rate for a utility company. However, in the short term, the stock appears to be trading at a rich valuation compared to historical levels. (click to enlarge) Compared to a normal PE of 16.2 over the last decade, the current ratio of 21.3 would indicate that shares are trading at a 30% premium to normal values. The current yield shown has not yet updated to the newly announced dividend rate, but the 3.55% yield at that payout is still low compared to historical levels. Much of this premium being paid by the market is due to U.S. Treasuries trading at historically low levels, which is driving income seeking investors into equities as they search for yield. I discussed this in a recent article covering the utility sector , and a similar situation is being seen in the REIT sector as well. This trend has been reversing in recent weeks, as the Treasury rate has rebounded and the utility sector, as shown by the Utilities Select Sector SPDR ETF (NYSEARCA: XLU ), has sold off. 10 Year Treasury Rate data by YCharts Circling back to Dominion, it appears that the share price was driven up by macro factors, as the sector traded higher on the weaker Treasury rate. With that rate appearing to be normalizing, there could be some continued short-term pain for Dominion investors. Dominion is a great company with multiple drivers leading to continued growth. I think it deserves a spot in my portfolio as a core holding, but the valuation appears stretched at current prices. This is a company I hope to own, and it has been added to my watch list for my dividend growth portfolio . I will be looking for an entry point at around $65, which would provide a dividend yield of 4% that would pair quite nicely with an 8% dividend growth rate going forward. Disclosure: The author has no positions in any stocks mentioned, and no plans to initiate any positions within the next 72 hours. (More…) The author wrote this article themselves, and it expresses their own opinions. The author is not receiving compensation for it (other than from Seeking Alpha). The author has no business relationship with any company whose stock is mentioned in this article. Additional disclosure: I am a Civil Engineer by trade and am not a professional investment adviser or financial analyst. This article is not an endorsement for the stocks mentioned. Please perform your own due diligence before you decide to trade any securities or other products.

Get Him To The GREK

The Global X FTSE Greece 20 ETF is a great way to leverage a favorable resolution between Greece and the euro-zone. The GREK is far off its 52-week high of $25.76, largely due to the political developments that have led investors to speculate about Greece leaving the euro-zone. The security is up from its low of $10.44 recently because of an increasing understanding that a favorable resolution is likely. Opportunity exists for near-immediate appreciation on the announcement of a favorable resolution as early as next week. Over the course of this year, the GREK ETF should gain further as it reflects the benefits of ECB actions like Greece’s peer markets have. Investors interested in leveraging the prospect of a favorable Greece resolution, but hoping to limit risk to any one individual Greek security, can look to the Global X FTSE Greece 20 ETF (NYSEARCA: GREK ). The security has come off its highs on fear that Greece could leave the euro-zone. Though it has also come off its lows on the prospect of a favorable resolution, it still has a way to go higher because of the ongoing absence of that event. I think investors can buy it here for immediate upside to $15 on a quick fix and longer-term gain to $17 to $20 this year. 5-Year Chart of GREK at Seeking Alpha As you can see here in the long-term chart of the Global X FTSE Greece 20 ETF, it has recently fallen precipitously. The reason for the decline should be obvious to anyone who has not been on a deserted island for the last couple months, save for a Greek island. When the popular Syriza party was elected into power in Greece, and before that when the polls showed it could be, Greek securities started to sell off. That was because of the tough talk against austerity that emanated from the party and its leaders. Fear rose that Greece could leave the euro-zone or be ejected from it due to the change in political power. But as time has passed, investors have become aware of what I already knew. Tough-talking Greek leaders do not have the backing of the Greek people to leave the euro-zone, as polls show a great majority of Greeks would vote against it in a referendum. That was known even before the elections, and Syriza indicated it was not interested in leaving the euro-zone, ensuring its election. However, Syriza still wanted an alteration to the bailout deals Greece had previously agreed to, due to the great damage austerity has done to many Greeks. The medicine while beneficial for the long-term economy was administered too much too soon and it made a good deal of Greeks sick, if not, unemployed. Over recent weeks, the emergence of a somewhat free-speaking Finance Minister, and Greek Defense Minister’s demands for Nazi war reparations have only stirred up more concern among the global investment community. Greek demands were met with tough talk from the Germans and other EU partners, so it got scary for some investors, who then bid the GREK security down to $10 and change. When the fear was palpable, I went long National Bank of Greece (NYSE: NBG ) at approximately $1 using long-term call options. Thanks for telling us now Greek , is what you are saying, but for your information, I just went long GREK Friday and it’s not too late still. I never had concern about the future of Greece, and was long GREK a few months ago at around $17. If Greece agrees to continued currency relations with its euro-zone partners, however altered the structure of the deal could be, much fear currently priced into the security must go away. Greece said today it will do whatever it can to reach a deal to keep it in the euro-zone; it has until February 28, but there is talk that a deal could be consummated as early as Monday. And it is in Germany’s interest to keep Greece in the euro-zone, because the presence of weak partners limits the upside of the euro, which serves Germany’s exports. 1-Month Chart of GREK GREK currently trades at approximately $13.63, after rising about 5% Friday. It was up Thursday too, and as you can see here, it has come off its low of $10.44. But GREK has upside from here, because before Syriza was elected, the security traded upward of $15, and before it was a concern altogether, it traded even higher with a 52-week high of $25.76. Now some of the security’s decline has been due to the general weakness of the European economy and that of Greece over the last 12 months, but Greek stocks should be benefiting year to date from the actions of the ECB, like its peers are. The iShares Europe ETF (NYSEARCA: IEV ) is up 4.8% year to date while GREK is down 5.5%. The Global X FTSE Portugal 20 ETF (NYSEARCA: PGAL ) is up 2.2%; the iShares MSCI Spain Capped ETF (NYSEARCA: EWP ) is only down 2.8% year to date because of Greece and Spain’s own similar political issues. Thus, given European shares seem to be finding bids here, there appears to be room to grow for GREK beyond just the immediate gain that should occur once it is clear Greece will remain in the euro-zone. I’m not anticipating a quick recovery to the 52-week high, but an immediate move to above $15 on a positive resolution seems likely to me. From there, I see no reason why the security that marks the Greek market cannot approach $16 in short time and $17 to $20 before year-end. So I say, get him to the GREK. I have been following these Greek developments, so interested parties may find value in following my column . Disclosure: The author is long GREK, NBG. (More…) The author wrote this article themselves, and it expresses their own opinions. The author is not receiving compensation for it (other than from Seeking Alpha). The author has no business relationship with any company whose stock is mentioned in this article.

How Much More Compelling Is The Southern Company Today?

Recently I provided an update on the Southern Company, suggesting that 5% intermediate-term return expectations might be a reasonable baseline. Since that time, the share price has declined dramatically. This article looks at “how much more compelling” the company is today. On February 4th I published an article regarding the Southern Company’s (NYSE: SO ) fourth quarter and full year earning results. Within this update I indicated that 5% annual total returns over the intermediate-term might serve as a reasonable expectation moving forward. This was based on a growth assumption around 3% coupled with a future earnings multiple around 16 — both of which were in-line with the company’s history. At the time, shares were trading around $51. Today, less than two weeks later, the share price for the Southern Company is closer to $46.50 — a 9% decrease in a very short amount of time. Which naturally brings about a question: “are shares now more compelling? And if so, to what degree?” Barring any extraordinary events, and given that one’s assumptions probably haven’t changed, a lower share price necessitates that the investment proposition has become more attractive. You would still expect the same growth and future valuation as you might have two weeks ago — so a lower price means more value. However, figuring out the quantity by which the value proposal has changed is the important part. It doesn’t really mean much if 5% expected returns turn into 5.1% yearly returns. So let’s work through an illustration to determine a reasonable investment baseline based on today’s price. As indicated in the previous article the Southern Company had adjusted earnings per share of $2.80, while paying out nearly $2.10 in dividends per share. At the time, as is the case now, analysts are expecting growth of just over 3% , which we’ll assume to be an even 3%. That’s 3% growth in earnings alongside 3% growth in the dividends per share. Finally, we’ll use a future earnings multiple of 16 — quite close to the historical mark of the past decades. All of the assumptions stay the same — after all it’s been less than two weeks. What changed is the share price. Here’s a look at what the dividends per share might look over the next five years: 2015 = $2.15 2016 = $2.21 2017 = $2.28 2018 = $2.35 2019 = $2.42 At $51, the “current” dividend represented a 4.1% yield and you might have expected to receive 23% of your original investment back in the form of dividend payments over the next half-decade. With a share price of $46.50, this represents a “current” yield closer to 4.5% along with the expectation of receiving nearly 25% of your initial capital back during the next five years. Already you can see a difference. If earnings were to grow by 3% annually, this would lead to adjusted earnings around $3.25 five years later. A 16 multiple translates to a future price of roughly $52. Incidentally, given an adjusted payout ratio around 75%, this also equates to a future anticipated dividend yield of about 4.7%. As previously mentioned, these assumptions would have lead to expected total returns near 5% (actually 4.6%, but rounded up). With today’s price, this equates to expected annual returns of about 6.4%. In other words, the 9% decrease in share price has increased the baseline expected total return by roughly 1.8% per annum. How much of a difference does that make? Well over a five-year period, investing say $10,000, this would be the difference between an end value of $12,500 versus roughly $13,600, for the higher annual return (the difference is nearly $10,000 over 20 years). The amount of expected dividends and future share price remain, but you can now purchase these same expectations at a lower price. No different than buying milk at the grocery store — the calories and nutrients don’t change, but the price (and thus value received) can fluctuate. Of course you can’t continue to do this analysis everyday. Well, you can — but I can’t write an article on the Southern Company every time the price changes. In lieu of that, I thought it might be useful to provide a range of total return assumptions based on the aforementioned assumptions and a varying share price. $40 = 9.6% annual expected returns $42 = 8.6% $44 = 7.6% $46 = 6.6% $48 = 5.7% $50 = 4.8% $52 = 4% $54 = 3.2% Granted you could have different assumptions for the company. To this point you could adjust the above numbers or else develop “valuation shortcuts” as I have previously demonstrated . The idea is to have a general notion of how the current share price of a security fits in with your underlying expectations. At $50+ you’re basically collecting the dividend payment without much anticipation for capital appreciation — sans a higher earnings multiple in the future. At today’s share price you might expect to receive the 4.5%+ dividend along with slight share price growth over the intermediate term. And once you hit $42 or so, the returns are roughly half dividends and half expected capital gains. As time goes on, with the Southern Company or any one of your contemplated holdings, expectations will change and you can adjust for that. Yet I would contend that your assumptions don’t change all that much (or at all) from day to day. The share price can fluctuate widely, especially in comparison to the longer-tem business results. The best you can do is create a baseline and judge a security in comparison to your alternatives through time. Disclosure: The author is long SO. (More…) The author wrote this article themselves, and it expresses their own opinions. The author is not receiving compensation for it (other than from Seeking Alpha). The author has no business relationship with any company whose stock is mentioned in this article.