Tag Archives: income

Treasury Yields Have Me Shying Away From Buying Some More Dominion Resources
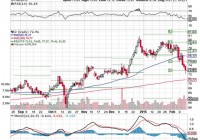
Summary The stock appears to be fairly valued on next year’s earnings estimates. Increasing treasury yields has people investors leaving safe-haven yields plays such as Dominion. The company at least pays a great dividend to help stem the losses on the capital side of things. Dominion Resources (NYSE: D ) is a producer and transporter of energy. It manages its daily operations through three operating segments namely Dominion Virginia Power of DVP, Dominion Energy and Dominion Generation. On February 6, 2015, the company reported fourth quarter earnings of $0.84 per share, which beat the consensus of analysts’ estimates by $0.01. In the past year, the company’s stock is up 2.53% and is losing to the S&P 500, which has gained 14.03% in the same time frame. Since initiating my position in the growth portfolio back on December 23, 2014, I’m down 4%. I’d like to take a moment to evaluate the stock to see if right now is a good time to purchase more for the growth portfolio. Fundamentals The company currently trades at a trailing 12-month P/E ratio of 28.37, which is fairly priced, but I mainly like to purchase a stock based on where the company is going in the future as opposed to what it has done in the past. On that note, the 1-year forward-looking P/E ratio of 18.66 is currently fairly priced for the future in terms of the right here, right now. The 1-year PEG ratio (5.52), which measures the ratio of the price you’re currently paying for the trailing 12-month earnings on the stock while dividing it by the earnings growth of the company for a specified amount of time (I like looking at a 1-year horizon), tells me that the company is expensively priced based on a 1-year EPS growth rate of 5.14%. Financials On a financial basis, the things I look for are the dividend payouts, return on assets, equity and investment. The company pays a dividend of 3.55% with a payout ratio of 101% of trailing 12-month earnings while sporting return on assets, equity and investment values of 2.9%, 12.9% and 7%, respectively, which are all respectable values. Because I believe the market may get a bit choppy here and would like a safety play, I believe the 3.55% yield of this company is good enough alone for me to take shelter in for the time being. The company has been increasing its dividends for the past 11 years at a 5-year dividend growth rate of 6.5%. Technicals (click to enlarge) Looking first at the relative strength index chart [RSI] at the top, I see the stock approaching oversold territory with a current value of 36.65. I will look at the moving average convergence-divergence [MACD] chart next. I see that the black line is below the red line with the divergence bars decreasing in height which tells me bearish momentum may continue in the name. As for the stock price itself ($72.91), I’m looking at $74.85 to act as resistance and the 200-day simple moving average (currently $70.77) to act as support for a risk/reward ratio which plays out to be -2.94% to 2.66%. Wrap Up After taking a look at the stock I think I’ve determined this is not a good place to be buying more of the stock right now. Fundamentally I believe the company to be fairly valued on next year’s earnings estimates and expensive on future earnings growth. Financially, the dividend is great and doesn’t have a lot of room to grow. On a technical basis the risk/reward ratio shows me there is more risk than reward right now. With interest rates on the ten-year treasury beginning to climb these utility names have begun to take a hit. So I’d first like to see the utility stocks decouple first from the treasury yields before I buy some more of this particular name. Disclaimer: This article is in no way a recommendation to buy or sell any stock mentioned. This article is meant to serve as a journal for myself as to the rationale of why I bought/sold this stock when I look back on it in the future. These are only my personal opinions and you should do your own homework. Only you are responsible for what you trade and happy investing! Disclosure: The author is long D. (More…) The author wrote this article themselves, and it expresses their own opinions. The author is not receiving compensation for it (other than from Seeking Alpha). The author has no business relationship with any company whose stock is mentioned in this article.
Yet Another Reason To Like CORN: A Low Valuation Relative To Gold

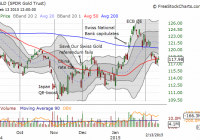
Summary The gold/corn ratio is extremely high relative to recent history. The bounce in CORN since a 40-year high (at least) in the gold/corn ratio seems to confirm a mean reversion is underway. Given corn’s strong underlying demand and a likely trading range for gold, I am betting on higher corn prices to drive most of the on-going mean reversion. I am finally starting to look over the rich agriculture-related resources provided by Teucrium Trading LLC , the financial firm that runs several agricultural ETFs: Teucrium Corn ETF (NYSEARCA: CORN ), Teucrium Soybean ETF (NYSEARCA: SOYB ), Teucrium Sugar ETF (NYSEARCA: CANE ), Teucrium Wheat ETF (NYSEARCA: WEAT ), and Teucrium Agricultural ETF (NYSEARCA: TAGS ) (TAGS invests the other four Teucrium ETFs). As an investor in CORN, I am particularly interested in understanding the supply and demand dynamics of the corn industry. What has my attention right now is an apparent trading signal provided by the amount of gold (NYSEARCA: GLD ) it takes to buy a bushel of corn. It is common to quantify the price of goods using gold as a frame of reference independent of a given paper currency. I have done this with oil and the S&P 500, but I have never thought to do it with agricultural products. In ” Portfolio Rebalancing – a Potentially Golden Opportunity ,” Teucrium references a Bloomberg article from September 24 titled ” Corn Trading Cheapest to Gold Since 1975 Signals Bottom ” to describe the opportunity for exchanging relatively “expensive” gold for relatively “cheap” corn. While I argued last month that it was time to end short-term trades going long gold , I did not think of gold being expensive (more like overbought relative to bets against path to monetary tightening). As expected, SPDR Gold Shares has fallen from the peak defined by QE in the eurozone…Yet, trading just above 5-year lows, it hardly “seems” expensive CORN is also trading near levels last seen five years ago, but it has dropped by 50% and more from recent highs. Since reaching its peak in 2012, CORN has traded ever downward with only two respites The current respite for CORN started, you guessed it, right after the Bloomberg article appeared noting corn’s cheapness relative to gold. Here is a telling chart reproduced by Teucrium. Corn is as cheap as ever relative to gold When I have argued for buying CORN off the lows , I have mainly relied upon a contrary argument that plays on an assumed cyclic nature of the prices for agricultural commodities. I have also noted strong underlying long-term demand dynamics confirmed by Deere’s CEO and soaring demand in China . However, the supply side has been volatile – corn has enjoyed several bumper crops after massive droughts in the U.S. last sent corn prices soaring in 2012. The February, 2015 U.S. Department of Agriculture (USDA) report reproduced by Teucrium along with other worldwide data shows U.S. corn inventory projected at 1.8B bushels, levels last seen in the 2005-2006 crop year. Current inventories are 13.4% of projected total usage. Similar percentages were last seen between the 2008-2009 and 2009-2010 crop years. This five-year high for corn inventory relative to total usage is an important benchmark because it turns out that worldwide demand for gold hit a five-year low at the end of 2014 . These 5-year spans for corn and gold could of course be pure coincidence, but they put current dynamics in good longer-term perspective: current conditions are pushing toward extremes. Assuming that gold is going into a new trading range roughly between the 2014 low and the 2015 high, my bet is on higher corn prices to move the gold/corn ratio closer to a mean reversion. Be careful out there! Disclosure: The author is long CORN, GLD. (More…) The author wrote this article themselves, and it expresses their own opinions. The author is not receiving compensation for it (other than from Seeking Alpha). The author has no business relationship with any company whose stock is mentioned in this article. Are you Bullish or Bearish on ? Bullish Bearish Neutral Results for ( ) Thanks for sharing your thoughts. Submit & View Results Skip to results » Share this article with a colleague

ALLETE (ALE) Q4 2014 Results – Earnings Call Webcast

The following audio is from a conference call that will begin on February 17, 2015 at 10:00 AM ET. The audio will stream live while the call is active, and can be replayed upon its completion. Are you Bullish or Bearish on ? Bullish Bearish Neutral Results for ( ) Thanks for sharing your thoughts. Submit & View Results Skip to results » Share this article with a colleague