Tag Archives: income

UBS Rolls Out Leveraged US Small Cap Dividend ETN

Concerns related to dividend ETFs are evident, given higher chances of the Fed hiking interest rates sooner than expected in the U.S. Yet, income ETFs draw enough attention thanks to persistent global turmoil (read: 3 ETFs Yielding Over 6% to Watch as Market Speculates Rising Rates ). There are plenty of options in this space too, as a number of providers launched new dividend ETFs over the past few months. While the space is definitely jam-packed, UBS – a leader in exchange-traded notes – discovered room for yet another play in the leveraged dividend ETF space. Consequently, the company rolled out a new income fund namely ETRACS Monthly Pay 2xleveraged US Small Cap High Dividend ETN (NYSEARCA: SMHD ) targeting the U.S. small-cap space. Inside SMHD This ETN looks to follow two times the monthly performance of the Solactive US Small Cap High Dividend Index. This benchmark consists of 100 high dividend yielding small cap U.S. firms. Top holdings for the ETN’s underlying index include LinnCo LLC (NASDAQ: LNCO ) (5.98%), Denbury Resources (NYSE: DNR ) (5.75%) and Peabody Energy (NYSE: BTU ) (5.22%), all of which account for over 15% of the note. In terms of yield, the index pays about 17% per annum (as of February 3, 2015) to investors, a pretty solid level. And for such a smart exposure, the cost does not seem steep as the product charges 85 bps in fees, which is lower than the average expense ratio charged by the leveraged equity ETFs. As far as country exposure is concerned, the product puts about 93.6% of assets in the U.S. followed by Bermuda (5.3%) and United Kingdom (1.1%). Investors should note that the product carries the credit risk of UBS AG (NYSE: UBS ) attached to it, though the issuer is considered a high-rated and sought after financial institution. How Does it Fit in a Portfolio? This ETF is an intriguing choice for investors seeking a new take on income investing. It could also be appropriate for investors seeking to ride out the U.S. growth momentum amid global meltdown and earn substantial yield as the domestic economy seems set to hike the key interest rates this year. Notably, given the currency concerns and global turmoil, small-caps appear better bets than large caps when it comes to investing in the domestic arena. After all, these pint-sized equities revolve around the domestic economy more than the large caps, which normally have a wider foothold abroad (read: Investor Guide to Small-Cap Value ETFs ). On the other hand, the ETN does not look to be a pricier option giving investors another reason to bend towards it. Plus, a monthly rebalancing strategy is a winning criterion in the leveraged space as many other products rebalance on a daily basis, enhancing the risk quotient in the product (read: UBS Launches New Monthly Resetting Leveraged ETF ). Meet the Competitors The leveraged high yield space is still not chockablock. Among the trendy and coveted ones, UBS itself operates two products namely UBS ETRACS Monthly Pay 2x leveraged Dow Jones Select Dividend Index ETN (NYSEARCA: DVYL ) and UBS ETRACS Monthly Pay 2x leveraged S&P Dividend ETN (NYSEARCA: SDYL ) . While SDYL targets a monthly 2x version of the 50 highest dividend yielding firms in the S&P Composite 1500 Index and DVYL focuses on the Dow Jones U.S. Select Dividend Index which screens by the dividend per share growth rate, dividend payout percentages, and average dollar trading volume, and then selects on the basis of dividend yield. SDYL has an asset base of $21.9 million and charges 30 bps in fees while DVYL has so far amassed about $33 million in assets and charges about 35 bps in fees. SDYL yields 4.45% in dividends annually (as of February 13, 2015) and DVYL yields 6.50%. Considering these options, the small-cap concept is fresh in the leveraged equities ETF space and should not face much problem in hoarding investors’ money. Though the product is priced higher than the issuers’ older offerings, a novel theme and a substantially higher yield opportunity should more than compensate for increased costs.
New High Income Global Infrastructure ETF Fills A Void

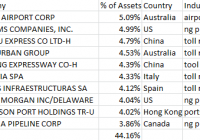
Backdated data suggests GHII could have a yield of 4.1%, vs a current yield of 2.06% for EMIF and 1.86% for PXR. GHII’s annual fees are almost half of EMIF and PXR. GHII’s has a more balanced portfolio with 20% of assets in the U.S. Many investors, myself included, use ETFs where investing in individual securities is difficult. A great example is the asset class of emerging market companies focusing on infrastructure. Infrastructure is broadly defined as those businesses involved in utilities, communications, transportation, port facilities, sewage, and water. Infrastructure is vital to the economic vitality and growth of any country. There is a new ETF in town that offers a bit of a twist on this theme. The Guggenheim High Yield Infrastructure ETF (NYSEARCA: GHII ) was launched last week and offers exposure to higher dividend income and a more diverse portfolio than its peers do. Guggenheim High Yield Infrastructure ETF is a replication of the S&P High Income Infrastructure Index, which are also components of the S&P Global BMI. A description from their website: The S&P High Income Infrastructure Index is designed to serve as a benchmark for yield-seeking equity investors looking for infrastructure exposure. The index is composed of the 50 highest-dividend-paying companies within the S&P Global BMI that operate in the energy, transportation, and utilities sectors. According to Oxford Economics and PwC, project global infrastructure spending will top nearly $78 trillion in 2014 and 2015 combined, with about 60% of that coming out of the Asia Pacific. GHII’s index allocates just over half its weight to utilities stocks, a third of its weight to the transportation/industrial sectors and 16% to energy names. The United States accounts for about 20% of initial geographical allocation while the rest of the fund is spread out over both developed and emerging markets. The next largest markets are Australia with 14% of allocation, China with 9%, and Spain and Italy with 8% each. However, many of these companies are multi-national and could have substantial assets in non-local market opportunities. It is important investors appreciate the portfolio of 50 stocks are rebalanced every 6 months. Due to this attribute, the composition, yield, and geographic diversity will change over time. Below is a review of the top 10 holdings of GHII, as listed on their website, listing the percentage of initial allocation, country of stock listing and the general industrial segment. The top 10 holdings represent almost half of the total allocation. There are two widely-held alternative global infrastructure ETFs: The iShares S&P Emerging Markets Infrastructure Index Fund (NASDAQ: EMIF ) and The PowerShares Emerging Markets Infrastructure ETF (NYSEARCA: PXR ). EMIF contains a higher percentage of utilities and infrastructure operators and PXR is heavily weighted to infrastructure construction. GHII exposure is 16% energy, 33% transportation and 51% utility vs a more balanced 15%, 45%, and 40%, respectively, for EMIF. PXR invests 61% in steel, construction firms and construction materials, and 90% of assets are invested in industrials and materials firms. GHII and EMIF are heavy to infrastructure operators while PXR is heavy to infrastructure builders. ETF Insight Comments posted on ETF.com: Newly launched GHII enters the global infrastructure space with a competitive fee and a strong emphasis on dividend yield. Like its peers, the fund invests in industries within the energy,transportation and utility sectors. GHII’s yield focus sets it apart from competitors; however, the fund does not just hold the dividend payers, it screens out all but 50 stocks with the highest dividend yield, and weights stocks by yield too. As such, we expect the fund to handily beat our benchmark and most-if not all-segment funds on yield, but not necessarily on total return. GHII does not screen for dividend sustainability, and like other yield-focused plays, may be adversely affected by rising interest rates. Still, assuming the fund can garner viable assets and liquidity, the fund will be an attractive take on the space for income-oriented investors. One of the main differences compared to other infrastructure ETFs is GHII’s focus on income. GHII’s backdating of performance shows an average yield of 4.15% on a 12-month basis, 4.68% on a 3-yr basis and 4.48% on a 5-yr basis. This compares quite favorable to its peers with 2.06% current yield for EMIF and 1.86% for PXR. On a performance basis, GHII has offered a better total return than the complete BMI Index. According to the Index website, a $10,000 investment in The S&P High Income Infrastructure Index in 2007 would be worth $17,500 while the total S&P BMI Index would have grown to $14,000. In addition, backdating the performance shows a potential substantial out performance than either EMIF or PDX. Below are two charts from S&P concerning its indexes: (click to enlarge) (click to enlarge) According to Morningstar, EMIF’s 1-yr total return is 6.36%, 3-yr total return is 2.81% and 5-yr total return is 5.51%. PXR has generated total returns of 1.59%, -0.52% and -0.57%, respectively. GHII charges 0.45% fees vs 0.75% for both EMIF and PXR. More information on GHII can be found at their website here and in their press release here [pdf]. The underlying S&P index factsheet is linked here . Investors should be aware of the impact of a rising or falling dollar on foreign stock ETFs. Usually, foreign stocks perform better in times of a falling U.S. Dollar than in times of a rising U.S. Dollar, and the trend since last May has been strength in the U.S. Dollar. While individual currencies may move higher or lower than the underlying trend in the USD Index, the impact on exchanging foreign share prices and dividend paid from foreign currencies to USD should not be overlooked. Based on just a 5% move in the USD either higher or lower, the yield could vary from 3.94% to 4.37%, everything else being equal. In addition, many foreign companies pay their dividend on an annual or semi-annual basis and the amount of the dividend can be more variable based on actual earnings. Income seeking, longer-term contrarian investors who believe the days of U.S. Dollar strength may be waning could be intrigued by the potential boost in the conversion of foreign cash dividends to U.S. Dollars during falling exchange rate trends. For investors looking for more stable international dividend exposure should review GHII. A combination of EMIF and GHII covers quite a bit of ground internationally with little overlap of positions. I have taken this avenue. Author’s Note: Please review disclosure in Author’s profile. Disclosure: The author is long GHII EMIF. (More…) The author wrote this article themselves, and it expresses their own opinions. The author is not receiving compensation for it (other than from Seeking Alpha). The author has no business relationship with any company whose stock is mentioned in this article.

BIK: Diversified Emerging Markets Means China, Right?

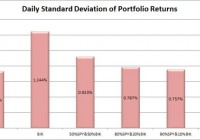
Summary The top 7 holdings are all Chinese, despite the ETF being labeled as diversified emerging markets. The standard deviation is pretty high and makes it difficult to try to use the ETF to lower risk across the total portfolio. On the positive side, the correlation is fairly low and the liquidity was solid which makes the statistics more reliable. I like investing in ETFs, and one of the ETFs I was looking at recently is the SPDR S&P BRIC 40 ETF (NYSEARCA: BIK ). It tracks the S&P BRIC 40 Index, and allocates at least 80% of the funds to the assets in the index. The Morningstar Category is “Diversified Emerging Markets”. However, after looking into it for a while I felt like it would be more representative to say the ETF is heavily invested in China. 67% of the ETF’s investments are in China. The only other markets included are Brazil, India, and Russia. I believe there are two methods for investing. Either you should know more than the other people performing analysis so you can make better decisions, or use extensive diversification and math to outperform most investors. Under CAPM (Capital Asset Pricing Model), it is assumed every investor would hold the same optimal portfolio and combine it with the risk free asset to reach their preferred spot on the risk and return curve. Do you know anyone that is holding the exact same portfolio you are? I don’t know of anyone else with exactly my exposure, though I do believe there are some investors that are holding nothing but the SPDR S&P 500 Trust ETF (NYSEARCA: SPY ). In general, I believe most investors hold a portfolio that has dramatically more risk than required to reach their expected (under economics, disregarding their personal expectations) level of returns. In my opinion, every rational investor should be seeking the optimal combination of risk and reward. For any given level of expected reward, there is no economically justifiable reason to take on more risk than is required. However, risk and return can be difficult to explain. I’ve been approximating risk by using the standard deviation of daily returns. Yields BIK has a 3.45% Distribution Yield and 2.65% SEC Yield. I believe a portfolio with a stronger yield is superior to one with a weaker yield if the expected total return and risk is the same. I like strong yields on portfolios because it protects investors from human error. One of the greatest risks to an otherwise intelligent investor is being caught up in the mood of the market and selling low or buying high. When an investor has to manually manage their portfolio, they are putting themselves in the dangerous situation of responding to sensationalistic stories. I believe this is especially true for retiring investors that need money to live on. By having a strong yield on the portfolio it is possible for investors to live off the income as needed without selling any security. This makes it much easier to stick to an intelligently designed plan rather than allowing emotions to dictate poor choices. In the recent crash, investors that sold at the bottom suffered dramatic losses and missed out on substantial gains. Investors that were simply taking the yield on their portfolio were just fine. Investors with automatic rebalancing and an intelligent asset allocation plan were in place to make some attractive gains. Expense Ratios The expense ratio for BIK is .50% for both gross and net expense ratios. Some analysts are heavily opposed to focusing on expense ratios. I don’t think investors should make decisions simply on the expense ratio, but the economic research I have covered supports the premise that overall higher expense ratios within a given category do not result in higher returns and may correlate to lower returns. The required level of statistical proof is fairly significant to determine if the higher ratios are actually causing lower returns. I believe the underlying assets, and thus Net Asset Value, should drive the price of the ETF. However, attempting to predict the price movements of every stock within an ETF would be a very difficult and time consuming job. By the time we want to compare several ETFs, one full time analyst would be unable to adequately cover every company. On the other hand, the expense ratio is the only thing I believe investors can truly be certain of prior to buying the ETF. I ran some historical numbers on the ETF and compared them to SPY to get a feel for how volatile the ETF was. My starting point was January 2012 and I ran the comparisons over a 3 year sample period. (click to enlarge) The portfolio had a 72.12% correlation to SPY when using daily values, which suggests a fairly significant connection. However, while SPY moved up substantially during the 3 year period, BIK had a fairly weak total return of only a few percentage points. In my opinion, it’s reasonable to think the daily correlation just reflects large amounts of money pouring in and out of the market. The returns over a long time period seem to be substantially less correlated to SPY. While SPY had a total return of 71.4% during that three year period, BIK returned only 4.95%. The liquidity looks solid with around 90,000 shares per day changing hands and 0 days in the last 3 years where the trading volume was 0. What are the holdings? Investors should at least glance at the holdings, even if they intend to buy an ETF on the premise that markets are efficient. By looking at the individual holdings the investors can check if the ETF will have a substantial overlap with other positions that they hold. In the case of BIK, investors should be aware of potential overlap with any other large holdings they have in China. (click to enlarge) Tencent Holdings Ltd. ( OTCPK:TCEHY ) is a Chinese investment holding company and Baidu Inc. ADR (NASDAQ: BIDU ) is a Chinese-language internet search provider. Outside of those 2, everything in the top 6 has China in its name. I assume most people are familiar with Alibaba (NYSE: BABA ). The first holding that isn’t in China is the 8th holding on the list. Conclusion BIK is an interesting ETF. At first it seems like it would be heavily diversified, but China is a fairly major position within the ETF. Therefore, when I am comparing BIK I may focus on comparing it to other Chinese focused ETF as much as I compare to other broadly diversified international ETFs. The standard deviation is very high, but I expect that for emerging markets. The total return for the sample period is quite sad, but the intent of diversification is to ensure a larger sample size that can reduce the overall level of deviations. However, the ETF does have fairly solid liquidity represented in both the average trading volume and the lack of days with shares changing hands. The yields are strong, which is a slight positive, but with the volatility of the ETF a retiring investor using it for yield would still be increasing the volatility of their portfolio. It’s a difficult call on which way to go in that regard and each investor would have to look at their personal tolerances. The ETF was at a significant premium to NAV when I looked. The expense ratio is not unreasonable for the exposure (emerging markets), but it did surprise that the emerging markets included so many major positions related to China. Disclosure: The author has no positions in any stocks mentioned, and no plans to initiate any positions within the next 72 hours. (More…) The author wrote this article themselves, and it expresses their own opinions. The author is not receiving compensation for it (other than from Seeking Alpha). The author has no business relationship with any company whose stock is mentioned in this article. Additional disclosure: Information in this article represents the opinion of the analyst. All statements are represented as opinions, rather than facts, and should not be construed as advice to buy or sell a security. Ratings of “outperform” and “underperform” reflect the analyst’s estimation of a divergence between the market value for a security and the price that would be appropriate given the potential for risks and returns relative to other securities. The analyst does not know your particular objectives for returns or constraints upon investing. All investors are encouraged to do their own research before making any investment decision. Information is regularly obtained from Yahoo Finance, Google Finance, and SEC Database. If Yahoo, Google, or the SEC database contained faulty or old information it could be incorporated into my analysis. The analyst holds a diversified portfolio including mutual funds or index funds which may include a small long exposure to the stock.