Tag Archives: income

Rising Rates Are Good For PHK, Part II
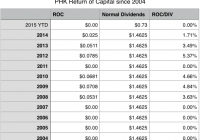
Summary PHK pays out 19.2% of its NAV in dividends to shareholders. This distribution is unsustainable, as the fund’s managers have increasingly relied on active investment in bonds, currencies, and derivatives to sustain payouts with minimal return of capital, thus increasing risk. If interest rates rise, PHK is likely to become less reliant on this riskier approach as its NII will increase. The greatest concern regarding Pimco High Income Fund (NYSE: PHK ) is its payout to NAV ratio. With NAV of $7.62 as of July 2nd and annual dividend payouts of $1.46256, the fund needs to get a 19.2% return to sustain its dividend. Bears argue that this is impossible, and that the fund has to return capital and deplete its NAV to maintain the unsustainable dividend. However, according to CEF Connect , PHK has not paid a Return of Capital in over a year. On top of that, PHK’s history of funding distributions through ROC is moderate. While 1.71% of distributions came from ROC last year, that is down from the prior two years: Also significant: the fund has not resorted to ROC to fund distributions in years of rising rates — years of ROC distributions coincide with times of heightened economic crisis (2008, 2009, 2010) for the most part, although the reliance of ROC during 2012, 2013, and 2014 indicates the fund has had some difficulty in covering distributions from income along. However, the consistent decline in ROC and the absence of ROC so far for 2015 suggests that the fund has been able to wean itself off this stop-gap. There is still a fear that the fund will need to resort to ROC soon, since the average coupon of the fund, according to its most recent holdings report , is 5.165%. Even with leverage, which has fallen to 29% in recent months, it seems there is no way the fund can return 19%. So how can PHK continue to cover dividends when it is paying out 19% on NAV? Clipping Coupons To understand this, we first need to take a step back and remind ourselves that the income a bond holder receives is not necessarily the same as the coupon rate. Bonds are frequently bought at a discount, particularly by institutional investors who have greater access to a market that is much less liquid than equities. Since PHK does not reveal the price it has paid for its holdings, and we can only infer how long it keeps certain holdings in its portfolio, coupon rates are useless in determining the sustainability of the dividend or the fund’s ability to earn a 19% return on NAV. Additionally, the fund’s use of derivatives, its arbitrage and hedging from shorting, and its currency trades make it impossible to know exactly how well operations can fund distributions to shareholders. A better way to understand the return it is getting from its portfolio is to compare its net investment income to its NAV. If we look at these, we see that the fund is now earning about a 12.4% return: This is nowhere near the 19% return that is necessary to sustain the dividend in perpetuity, but is much better than the coupon rates suggest. However, this might become the wrong way to look at this fund if rates rise sufficiently. A Better Investment on Rising Rates While it is undeniable that the low interest rate environment hurts PHK’s NII and its ability to sustain its dividend, the sustainability of those payouts improves considerably in times of higher rates, as the above chart suggests. NII has fallen 43% from 2006 to 2015 due to lower interest rates, and its NII is likely to rise if rates rise and the fund is able to purchase discounted issues with a higher coupon rate. The fund’s recent decline in leverage might indicate its managers are anticipating a rise in rates and are positioning themselves accordingly by freeing up access to capital. Much more crucially: a rise in rates will also help the fund cover dividends, as its NII-to-Dividend Ratio remained well over 100% until the Global Financial Crisis in 2008: Surprisingly, the fund’s NII-to-Dividend ratio remained strong in 2009, when its NAV plummeted to less than $3 at its lowest point. At that time, and for several years since then, the fund has been able to more than cover dividends through investment operations — the kind of arbitrage, churn, and derivative trading that investors pay for. (The significant exception, in 2012, was during Bill Gross’s tenure as manager of the fund. He is no longer with the fund or PIMCO.) The fact that the fund has relied on this kind of active speculation more than before 2008 suggests that there is considerably greater risk in the fund than there was then, but it may also suggest that the fund will become less reliant on such tactics when rates rise. While it is true that the total capital PHK has to invest is much less than in 2005-2008, making it a riskier investment than it was then, its access to higher-yielding bond opportunities in a rising rate environment may make it a less risky investment than it has been since 2008 and throughout the 7 years that the fund maintained its monthly dividend payouts. Conclusion PHK is not without its risks. Its reliance on derivatives and investment operations, particularly since 2009, means greater volatility in dividend coverage and a greater risk in a decline in NAV, as we have seen in four of the last 8 years since the Global Financial Crisis, including this year. At the same time, the fund’s ability to earn higher rates of income in periods of rising rates means that a sell-off due to rising rates is unwarranted. Most significantly, if rates do rise later this year or next year, PHK may find it easier to earn income from the high yield market and become less reliant on derivatives and active trading to boost returns. Disclosure: I am/we are long PHK. (More…) I wrote this article myself, and it expresses my own opinions. I am not receiving compensation for it (other than from Seeking Alpha). I have no business relationship with any company whose stock is mentioned in this article.
CAF: Trading At 20%+ Discount To NAV Due To Supply/Demand Imbalance

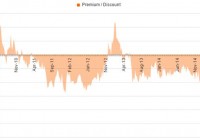
Summary Wave of investor outflows has created a significant dislocation. This provides an opportunity for those constructive on the Chinese market to obtain cheap exposure. For the rest of us, it also presents some potential to capture alpha through pair trades. Background on Closed-End Funds For those new to the space, a closed-end fund is a publicly traded investment company that raises a fixed amount of capital, and is then structured, listed and traded like a stock on a stock exchange. Whereas conventional mutual funds and ETFs frequently redeem/issue new shares to ensure that the price per share remains in line with the net asset value of the underlying holdings in the funds, this is not the case for CEFs. Rather the share price of CEFs is driven by the market forces of supply and demand, and can at times trade at either large discounts or premiums to NAV of the funds’ actual holdings. The Morgan Stanley China A Share Fund (NYSE: CAF ) is currently trading at one of the widest discounts in the CEF universe, due to a classic supply/demand imbalance. In particular, the Western media has inundated investors recently with headlines concerning the risks of a Chinese economic slowdown coupled with a potential bubble in the local equity market nearing its peak. The result is that the supply of CAF shares flooding the market from investors rushing to sell has overwhelmed demand, causing this CEF to now trade for a whopping ~20% below its NAV. In other words, for every $1 of net assets in the fund, investors now only need to pay ~80 cents to buy shares. (click to enlarge) Source: CEF Connect Morgan Stanley China A Share Fund Overview CAF is a reasonably large/liquid fund, with ~$936 million of total net asset value. The fund’s mandate is to invest at least 80% of its assets in A-shares of Chinese companies listed on the Shanghai and Shenzhen Stock Exchanges. Morgan Stanley is a longstanding/reputable CEF manager and the 3 executive/managing directors overseeing the fund each have more than a decade of experience in the Chinese market. The fund has a moderate annual expense ratio of 1.8%, and is currently relatively concentrated as shown in the table below. Also, the cash balance is now quite elevated (representing ~16% of NAV), which I view as a meaningful positive – after all, it’s hard to argue that cash in the hands of a reputable manager deserves a big discount. Plus, it gives the manager ammunition to take steps like share buybacks in the future to reduce the discount. Top 10 Holdings as of 5/31/15 % Of Portfolio Cash 16.1 Tsingtao Brewery Co., Ltd. Class A 10.0 China Resources Sanjiu Medical & Pharmaceutical Co., Ltd. Class 9.6 Industrial & Commercial Bank of China Ltd. Class A 8.7 Qingdao Haier Co., Ltd. Class A 5.2 China Pacific Insurance Group Co., Ltd. Class A 5.1 GoerTek, Inc. Class A 5.0 China Merchants Bank Co., Ltd. Class A 4.9 Kweichow Moutai Co., Ltd. Class A 4.4 Zhongbai Holdings Group Co., Ltd. Class A 3.7 Total 72.7 Source: Morgan Stanley CAF’s investor base is reasonably concentrated, with institutions holding approximately 37% of shares outstanding. Notably, Lazard holds ~$117mm or ~16% of total shares outstanding. This is also something I like to see when considering investing in a CEF that trades at a discount to NAV, as institutions holding major stakes are more likely than small individual/retail holders to pressure management to take steps to narrow the discount if this does not occur naturally over time. Source: NASDAQ So, What’s the Trade? For investors that want exposure to the local Chinese equity market, this CEF appears to be an attractive vehicle that is likely to deliver alpha from the discount reverting to more normalized levels over time. For others that have a more cautious view on the Chinese market (myself being one), there are also some potential opportunities to capture this alpha through pairing a long position in CAF with a short position in a Chinese equity ETF. There are several possible shorts to consider, but I present a couple below. CSOP FTSE China A50 ETF (NYSEARCA: AFTY ): This is a relatively small ETF with approximately $135mm of net assets. However, trading volume is reasonable, with ~$2.6mm/day in shares trading on average over the past 3 months. It is also currently relatively easy to borrow, with a cost under 2% through some retail brokers. The fund typically invests at least 80% of its total assets in the securities included in the FTSE China A50 index. This index is comprised of A-shares issued by the 50 largest companies in the China A-shares market. Direxion Daily FTSE China Bull 3X Shares ETF (NYSEARCA: YINN ): This alternative has more basis risk, but could also have the potential to produce more alpha. The fund has ~$181mm of net assets, with average daily trading volume of ~$20mm. YINN is not overly difficult to borrow, with a cost under 5.5% through some retail brokers currently. YINN seeks daily investment results, before fees and expenses, of 300% of the performance of the FTSE China 50 Index. This index consists of 50 of the largest and most liquid Chinese stocks (H Shares, Red Chips and P Chips) listed and trading on the Stock Exchange of Hong Kong, and is therefore a less tight match with CAF’s A share holdings. However, a potential benefit of shorting YINN is that one may benefit from the general tendency of levered ETFs to underperform over longer periods of time. There are several reasons for their underperformance including what is often referred to as a “leverage trap” (i.e., their tendency to decay in mean reverting markets from being forced to buy high/sell low), as well as elevated expenses that result from the higher trading activity needed to maintain these vehicles. The phenomenon is discussed in much more depth in academic literature (such as in this article ), as well as elsewhere on Seeking Alpha (such as here ). Risks/Considerations The main risk of this trade is that the timing of discount convergence is unclear, and if investors’ macro fears over China grow, there is a possibility that the discount could increase even further over the near term. The main mitigants are the facts that, as discussed above, the investor base is relatively concentrated with institutional investors, and the fund manager is reputable with dry powder in the form of excess cash to reduce the discount if it persists over time. Short selling of course also comes with added risks (e.g., possibility of force buy-ins, increasing borrow costs, etc.) and likely should not be attempted by those new to the market. Disclosure: I/we have no positions in any stocks mentioned, but may initiate a long position in CAF over the next 72 hours. (More…) I wrote this article myself, and it expresses my own opinions. I am not receiving compensation for it (other than from Seeking Alpha). I have no business relationship with any company whose stock is mentioned in this article.

Vietnam Holding: Nearly Triple The Return Of The VN Index

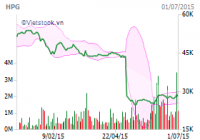
Summary Vietnam Holdings Ltd. had a 1 Year Return of 23.25%, which is substantially higher than the VN Index gain of 8.88%. A further increase in the fund’s price is highly likely for the following reasons: low valuation, recovery of multiple industries, and irrational drops in stock prices that will recover. Vietnam Holdings Ltd. is the best option for investors to gain exposure to Vietnam through US Exchanges. In a previous article , I mentioned the opportunities of investing in Vietnam, and how the Market Vectors Vietnam ETF (NYSEARCA: VNM ) was not the best means to profit off of the growth in Vietnam. When an investment fund is unable to outperform the index and has a negative return in a country with substantial growth, skepticism is befitting. The Market Vectors Vietnam ETF has had a 1 year return of -6.82% , while VN index has had a return of 8.88% . While the most successful funds are generally not listed on US Exchanges, Vietnam Holding Ltd.(OTC: VNMHF ) is a superior alternative that has outperformed the VN Index. Investors, who are bullish on Vietnam and want to trade on US Exchanges, should consider this fund as the most appropriate vehicle. Vietnam Holdings Ltd. is a closed end investment holding company in Vietnam that is listed on the US OTC market. The advantages of this fund include more attractive valuation, consistently higher returns, and its investment in two companies fully held by foreign investors. Performance Comparison Market Vectors Vietnam ETF Vietnam Holdings Ltd. P/E Ratio 15 5.33 Number of companies held with full foreign ownership None 2 1 year return -8.53% 23.25% 3 year return 2.68% 19.4% 5 Year Return -3.70% 14.7% ROE 12% 24.35% Vietnam Holding Ltd. has a very strong portfolio, with extreme low valuation, and more than double the ROE of the top listed equity holdings of the Market Vectors Vietnam ETF. Moreover, the fund’s financial performance has been excellent, particularly in the past year with a return of 23.25% . The current low valuation, coupled with specific companies that demonstrate high potential, will attribute to future success. Its success is mostly attributed to very recent successful performance in the past year, and the growth appears to be in the initial stages. The portfolio is holistically very strong, while I would say that the greatest potential will result from the performance of DHG Pharmaceutical, Petrovietnam Drilling and Well Services, Vinamilk, and Hoa Phat Group. Hoa Phat Group Hoa Phat Group is the most undervalued company, as its share prices have dropped substantially over the past months. The company is currently rated as one of the top 50 best listed companies in Vietnam Forbes and No. 7 for enterprises with the largest turnover. The company has the largest market share for steel production and steel pipe segments, with approximately 18% and 19.8%, respectively . The stock’s price has been constantly declining, although the sharp decline in the middle of May represents an adjustment of stock price due to the issuance of dividends and bonus stocks. I am currently holding Hoa Phat Group at a 9.15% loss, after investing initially in late April and buying down after this drop. Financial performance of the company has been consistent, with strong growth in net income, net revenue, and ROE since 2012. Moreover, Net Income increased by 37% in the 1st quarter of 2015. An increase in steel prices is projected for the future, which will result in recovery of the stock’s price. Vinamilk and DHG Pharmaceutical JSC Although it does not represent a large portion of the fund’s portfolio, the holding of Vinamilk and DHG Pharmaceutical JSC is very strategic, as these companies are fully held by foreign investors. Vinamilk is one of the most sought after companies by foreign investors, as many foreign investors are willing to pay a premium of up to 20% for shares of this company. The slight decline in net income in 2014, coupled with valuation that is not relatively attractive for Vietnam, has not been enough to deter investment away from this company; considerable growth is ahead for the company and its share price will surely increase. Its key position in the dairy market in Vietnam is crucial, as the industry is expected to grow by 9% up to 2020 . DHG Pharmaceutical is another very strategic holding of this portfolio, with average valuation for Vietnam and consistent growth. The company’s EPS is projected to grow by 34% in 2015 , making a rebound in its stock price extremely likely. These two holdings can be considered a major strength of this portfolio, although they only represent 13.7% of the fund’s portfolio. Moreover, there are certainly other companies fully held by foreign investors with better valuation and more potential for growth; some of these include Refrigeration Electrical Engineering Company, Military Commercial Joint Stock Bank, and FPT Corporation. The removal of the foreign ownership limitation in Vietnam, which will begin in some industries in September , will be extremely beneficial for this fund. Both companies are trading very near to their 52 week lows, and an increase in share price in the near future is highly likely, due to company’s valuation, projected growth, and prestige of being fully held by foreign investors. Petrovietnam Drilling and Well Services Petrovietnam Drilling and Well Services is another holding that is extremely undervalued and holding this company will be beneficial, as a rebound in price is inevitable. The sharp drop in price has been very irrational, resulting from the fear of the declining price of oil and some large investment funds selling holdings of this company. Despite the sharp drop in its share price, a large number of foreign investment funds are still keeping this company in their portfolio, in anticipation of a rebound in price. Beyond having extremely attractive valuation, the company has had consistent growth in net revenue since 2003 , even when oil prices fell below $40/barrel in 2009; net revenue increased by 9.9% and net income only fell by 9.5% in 2009. History has shown that the company is capable of continual growth, and its financial performance will not suffer if the price of oil plunges further. Currently trading at 53,000 dong, opportunity for a rebound is substantial as the company is extremely undervalued; the company’s share price dropped to its 52 week low at 42,800 dong earlier this year. General Strengths A large number of companies that this investment fund holds will have a significant increase in their share prices. This will result from a wide variety of factors, including: High value of companies fully held by foreign investors, and the removal of the foreign ownership limitation for some industries beginning in September . Adverse performance of industries, which are on track for recovery. Irrational drops in stock prices, which will be reconciled. A portfolio of companies with low valuation, that have demonstrated consistent financial performance. Favorable outlook for Vietnam stocks, as the VN Index was projected to increase to a seven year high to 655 : it is currently at 605.7 Conclusion I recommend Vietnam Holdings Ltd. as the best option for US investors wishing to invest in Vietnam. Moreover, investment into this fund should be a long-term endeavor, to ensure that investors profit off of the recovery of all industries and the reconciliation of companies that are undervalued. For those wishing to venture further and explore options not listed on US Exchanges, the following investment funds are most suitable: PXP Vietnam Emerging Equity Fund, Asia Frontier Capital’s Vietnam Fund, Tundra Vietnam Fund, and PYN Elite Fund. Editor’s Note: This article covers one or more stocks trading at less than $1 per share and/or with less than a $100 million market cap. Please be aware of the risks associated with these stocks. Disclosure: I/we have no positions in any stocks mentioned, and no plans to initiate any positions within the next 72 hours. (More…) I wrote this article myself, and it expresses my own opinions. I am not receiving compensation for it (other than from Seeking Alpha). I have no business relationship with any company whose stock is mentioned in this article.