Tag Archives: handle

Maybe You Should Be In 100% Cash

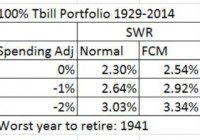
This post has nothing to do with asset prices, valuation, or timing the market as the title may have led you to believe. It has to do with investor psychology and behavior. Over the years I’ve wondered if certain types of people would be happier if they didn’t invest in anything but cash. Not ‘better off’ mind you just happier and still able to meet their financial goals – like a successful happy retirement. Then I said, “I have the data for that analysis.” Let’s take a look at the kind of people I’m talking about. You’ll probably see a bit of yourself in my description. Then let’s see what kind of retirement such a person could reasonably expect and some strategies to make it better. I think we all know the type of person I’m alluding to. Most investors have some of these traits. Constantly worried about any kind of investment. Stocks – they’re always too expensive or so cheap it’s an indication of some forthcoming dire event and thus they must continue to go down. International stocks – same thing, even worse. Bonds – even the mighty U.S. government is going default for sure. Any day now. Gold – sure, we gotta have a lot of that but I need to check the prices three times a day. And anytime prices go down it’s manipulation. Inflation – we’re constantly falling behind in standard of living. At the extreme, always worried about large inflation any day now. Yield – the need to reach for yield and check news every day that may affect the income stream. Price fluctuations of any significant amount are a sign to take action and seek refuge. Logging in to investment accounts way more than necessary and checking account balances. Glued to financial news of any kind. Tweaking investments all the time always looking for the better bet. In general, constant unease about the future and definitely not able to sleep comfortably at night. I may be exaggerating a bit but I know quite a few people, young and old, that would fit a large part of this description. And I think a large part of these people can overcome these behavioral obstacles, especially by adapting an automatic investment process or system like the ones I discuss on this blog. But I also often wonder if some people would be better off just sticking with investing in 100% cash and never taking any investment risk. They would be much happier. Let’s take that as a given and see how much could such a person expect to reasonably withdraw from their cash portfolio in retirement (which also determined what size portfolio such a person would need to retire). Let’s find out. Using the database I use to calculate SWRs (see here for an example), I replaced the U.S. 10 year bond returns with the historical series for the U.S. 3 month T Bill from 1929 to 2014 to represent cash returns. This is a pessimistic return series to use for cash returns but it’s the best series with that much history. Normally, even in environments with very low U.S. T Bill rates an investor can get cash returns out to 1 year that are quite a bit higher. For example, even with today’s low T Bill rates of 0.14% or so you can get a 1 year CD at many banks yielding over 1%. Below are the historical SWRs (Safe Withdrawal Rates) for a few scenarios with a 100% cash portfolio. The historical SWR for a 100% cash portfolio is 2.3% using a normal inflation adjusted spending model. That is quite a lot lower than the 4% from a 60/40 U.S. stock bond portfolio but definitely do-able. And definitely a portfolio that would have allowed for many more restful nights. The rest of the table shows what the SWR would be with some tweaks to the spending model. The FCM (floor-ceiling) model adjusts inflation adjusted spending down during bad return years. The spending adjustment column uses the historical fact that retirees’ spending increases less than inflation, between 1-2% less than inflation in fact. Using these better spending models increases the historical SWR to 3.34%. Doesn’t sound too bad now does it? Not too far off from the old 4% rule. But how realistic are these spending scenarios? In my opinion and in my experience the above spending scenarios are easily achievable. Think about what people did before easily accessible and low cost investment options. Investing was something reserved for the wealthy or least very well to do. It’s only in modern times that investing is so widespread and accessible. How did your parents or grandparents plan and survive retirement? If they were like my grandparents they planned and survived retirement through a combination of saving a lot and not spending a lot. There was never any investment talk. Getting them to trust bank CDs took almost 10 years! Yet they made it and were quite happy along the way. Sure, they could have been ‘better off’ but they wouldn’t have been as happy. Now lets turn to a modern and more tangible example, me and my wife Nina. From our base spending level in 2005, we spent 53% less in 2014. Yes, that involved a massive life change. By choice. You can read out it on Nina’s blog and even watch a little video about it. But it was for the better. Infinitely better for us. Oh, and that is in nominal terms. In real dollars, we spend 70% less (inflation has grown 2005 dollars by 20%) than we did in 2005. OK, that’s cheating a bit. At least in the ability to generalize from a very specific and personal choice. So, lets take our spending change since we started RV’ing in 2010. In 2014 we spent 10% less than we did in 2010. Inflation is up 8% since then. In real dollars that means we spend 18% less than we did in 2010. That’s over 3% a year. Obviously that can’t go on forever. And we’re pretty much at the bottom of the curve so to speak. Any further dramatic changes would require a reduction in quality of life which is not acceptable to us. Going forward our goal is to keep spending flat in nominal terms. Worst case to keep pace with inflation. I think that is pretty achievable. Our example just goes to show that controlling your spending so that it grows less than inflation is certainly achievable and not just data from some impersonal random study. The other aspect of future spending is that most people have some type of retirement or pension income that begins in later years. This is mainly social security. So, in order to get a truly realistic picture of the future we need to forecast cashflows on a yearly basis. Then we can get a true picture of what SWRs would look like from a 100% cash portfolio. Kind of like I talked about in this post . Let’s consider a 65 year old couple just beginning retirement, delaying social security until 70, a median social security income of that covers about 40% of their expenses, and controlling their spending so that it grows at 1% less than inflation. Taking this cash flow model and applying it to the historical returns from a 100% cash portfolio gives us a worst case SWR of 4.13% for the 30 year retirement period starting in 1942. Not so harsh a retirement after all. Even in 100% cash. And definitely many more restful nights than an equity heavy portfolio. In conclusion, sometimes taking an extreme position can be quite thought provoking and insightful. Admittedly, that is what I’ve done here. It was also a bit tongue in cheek. I’ve shown that even with a 100% cash portfolio a reasonable retirement can be had by focusing on the other side of the equation, spending, and using some more realistic retirement assumptions. People have been doing it for a long time. A lot longer than they have been investing in broadly diversified portfolios across world wide asset classes and markets. And maybe this thought experiment allows us to worry a bit less about our investments and have some more restful nights for just having thought through these alternative scenarios.

Start Living An Easier Life And Start Beating The Market Through Contrarian ETF Investments

Summary Periodically buying the SPY all the time might be too boring for some people. Mixing things up with this new strategy might be more their cup of tea. As an example, John, our imaginary investor, will be using this new technique during the Financial Crisis of 2009 and during the GREXIT fears of 2012. With this new strategy, John doubled his performance. He gained 40% during 2008 – 2009 instead of 20%, and 22% during 2012 instead of 11%. So why even pick stocks if you can pick ETFs? It’s safer, easier and you’ll be able to beat the market. Discover 3 very interesting opportunities in the market right now, that might also lead to above average results. John might be getting a first position right now. In my previous article , we learned that life could be much easier and that perhaps joining them instead of trying to beat them might be the better option. However, in today’s article, I’ll dig deeper and see if simple investors like John can actually beat the market – by doing just one thing differently. Yes, there’s a way to still beat the market. And today, we’ll back-test that way 2 times + I’ll give you three possible opportunities that might lead to those same market-beating results. The portfolio strategy I’m going to describe to you during this article is all about two words: ‘Contrarian’ and ‘ETFs.’ It’s the Contrarian ETF Strategy. Let’s break down those words. A contrarian: A person who takes a contrary position or attitude; specifically: an investor who buys shares of stock when most others are selling and sells when others are buying. An ETF: A security that tracks an index, a commodity or a basket of assets like an index fund, but trades like a stock on an exchange. So the strategy goes as followed: Instead of picking individual shares of a company that is in trouble – which continues to be the more risky way of being a contrarian – we now decide to periodically buy an ETF related to an industry/commodity or country that is in trouble. You see, each year, there seems to be some sort of crisis going on somewhere in the world. Often does everyone think the world will end (for that particular industry that is in trouble) but in 99% of these cases, the world doesn’t end and these industries find ways to survive. Crises often are opportunities – when played right – and I bet you’re feeling the same thing. Are oil companies offering the opportunity of a lifetime right now? And how about oil suppliers and companies delivering services to oil companies? And what about Russia? Is Russia an opportunity or a value trap? Will the Ukraine – Russia war really last forever? Will oil remain below $100 during the next 10 years? Will Greece leave the EU? Well, I don’t know all the answers, but I do know that I’m very inclined to say “NO” to all of these questions. People love drama. And we all love doom-scenarios. But how often did any of them played out? Also, when you really think about it: Does oil really have to be at $100 before you – as an investor – can make a profit of certain oil related stocks? Hell no. Certain stocks would jump 20% if oil would make a 5% recovery, or would show signs of a simple stabilization. Does Russia really have to report a 2% GDP growth figure before you, as an investor, can make a decent profit? Hell no. Anything positive, anything that gives investors the outlook that “things will get normal again” will make Russian stocks go nuts (hence the 10% bounce in 4 days time that occurred last week). However, while most investors recognize these opportunities and see the possible value in these areas of the market right now, they often see things too pessimistic and are too uncertain. “I don’t know anything about Russian or Greek stocks. I know nothing about oil companies or their suppliers, I don’t know which ones are the good ones.” Well you don’t have to know which ones the good ones are. That’s what ETFs are for. John’s strategy during the financial crisis of 2009. Remember John from my previous article? Well, he’s back in town. John is still buying the SPDR S&P 500 Trust ETF (NYSEARCA: SPY ) each month, and just like he was in my previous article, he still is a pretty smart guy that loves to seize opportunities whenever they come along. Last time, he decided to double his investment efforts during the financial crisis. Instead of buying $500/month during 2009, he decided to buy $1000/month. This time, he’s about to do something even more smart. John figures that the industry that is being hurt most, will also have most upward potential. But instead of picking individual stocks and making risky/uncertain decisions that will make him sleep bad at night, he decides that now is the time to buy a financially related ETF. The iShares Global Financial ETF (NYSEARCA: IXG ) seems to be perfect, as it covers 240 banks. This way, he tries to profit – like a real contrarian – from an industry that is in serious trouble while not exposing himself to too much risk. John puts his monthly investments in the SPY on halt and puts his $500 in the IXG instead. However, like we mentioned, John is a very, very smart guy and he knows that a crash can go on for a long time, and thus that chances are real that he gets in too early. Therefore he has one rule when it comes to his contrarian plays: He will only get a first position after a 40% drop. On October 7, 2008, John finally gets what he wants. The IXG fell 40%. From $58 to $34, and John decides to make a first purchase. He then adds to this position the first of each of the following 11 months. After eleven months, and after investing his 6k, John possesses: 202 shares at an average price of $29.64. Which is far below his original entrance point. Thank god he didn’t went all in at once and stayed with the $500/month rule. (click to enlarge) With this strategy, John scored a ~40% return while not having to time the market, not having to take individual risky picks and while keeping it simple. If he had invested in the S&P 500 through the SPY this whole time, then he had gained 19%. So he doubled his return by making a simple shift in where he puts his assets. Of course, this is just one example where dollar cost averaging on an ETF of a sector in trouble turned out very nicely compared to the regular SPY and this is not a representation of any future scenario. So in order to make this theory a little more valid, let’s take a look at a second example. Same strategy, different scenario During the European Debt Crisis in 2012; everyone thought that Greece would be leaving the Eurozone and that the country would be doomed. On May 16, its main index (the ATHEX), had lost more than 40% compared to its year high in Feb., and was now quoting at 209 points. John didn’t belief that Greece would have to leave the Eurozone (damaging only itself and other members of Europe) and thus he decided to expose himself to the country as a whole. He again stops purchasing the SPY – and decides to buy the Global X FTSE Greece 20 ETF (NYSEARCA: GREK ) with his $500/month. After 11 months of dollar cost averaging, John held 625 shares of GREK at an average price of $14.12 while the index was now above $17. John was able to gain a nice 22% in a relatively safe way, while knowing nothing about Greek stocks. At a certain point, he was sitting on a 40% profit. More interesting though, is that John would have only gained 11% if he had continued to buy the SPY during the same period. So yet again John doubled his return. Conclusion Although periodically investing in the SPY should give one decent returns over time, it seems very likely that whenever a sector/industry/country appears to be in trouble, it might be a wise thing to shift your deposits from the SPY into an ETF related to this industry for the course of a year – after they’ve dropped ~40%. This could lead to market-beating results without much effort and without too much risk. Today, I’m seeing 3 great contrarian plays that fit John’s new strategy: Greece Greece is yet again being confronted with a “Grexit” and the ATHEX dropped more than -44% since January 2014. John would be getting his first position now, and this could lead to above average returns within a year from now. As Aristofanis explains here , a Grexit is very unlikely, just like last time. Russia The Russian index has fallen -48% since January 2014 and is also offering a high risk/reward. A first position of $500 now, could lead to market-beating results within a year from now, if you continue to dollar-cost average on the Market Vectors Russia ETF (NYSEARCA: RSX ) the following months. The fact that you’ll be dollar cost averaging + that you’re buying not a few specific Russian companies, is definitely lowering your overall risk. The Russian – Ukraine conflict can’t go on forever and the sanctions that Europe imposed on Russia could be relieved sooner than expected. Russia is in real trouble, now that the rouble and oil prices dropped so much: It’ll simply have no other choice than to retreat and to improve the situation with the Ukraine in order to save its economy. Oil Oil prices have taken a steep dive and thus it might be more than interesting to consider a position in the SPDR Oil & Gas Exploration & Production ETF (NYSEARCA: XOP ), as it is down more than -45% since its all-time-high of mid last year and holds ~83 holdings. However, further downside is definitely possible as oil hasn’t found its bottom yet. By Q3 of 2015 or early 2016 however, I belief that oil prices will start a sharp recovery. The commonly held belief is that Saudi Arabia is keeping prices so low by not lowering its production to put a stop to the rapid growth of production from the U.S. shale oil plays. Others believe it is their goal to crush the Russian and Iranian economies. If the oil price remains at the current level for a few months longer it will do all of the above and then it has succeeded. Also don’t forget that the low oil price will lead to an increased demand from all major economies who are thrilled to get themselves some cheap oil, if they all do this at the same time, there’s a possible shortage imbound which could lead to much higher prices in a short period of time. Mark Mobius, an economist and regular guest on Bloomberg TV recently said he sees Brent rebounding to $90/bbl by the end of 2015 and I agree with this vision. Although $70/bbl would also be good enough in order to make a profit of this ETF. Main source used for my oil prospects: Here . Read the full article, it is really interesting. Additional disclosure: All figures are coming from Yahoo Finance: I used ADJUSTED figures for dividends and splits for simplicity purposes. Returns are supposed to be accurate though.

Investing In Africa: A Long-Term Growth Opportunity?

Summary Certain indicators point to an overvalued S&P 500. Prudent investors should consider more attractively valued indexes. Despite headwinds, Africa’s improving fundamentals suggest long term growth opportunities. As the new year begins to take shape, most investors have their attention squarely focused on the United States as the oasis of growth in a desert of underperforming national economies. Nevertheless, when we take a closer look at the key American stock market index, the S&P 500 (NYSEARCA: SPY ), it would appear that many market observers consider it to be overvalued. Some suggest that its blended P/E ratio of 17 is on the upper end of its historical normal valuation range since 2001, others warn that it is historically expensive relative to GDP and finally most point to the Shiller P/E which currently sits at 26.4, which is 59% higher than the historical mean of 16.6. Although it is difficult to make accurate broad valuation forecasts for a large collection of companies such as the S&P 500, such forecasts can be useful to the prudent investor. If we are willing to accept that many companies trading on the S&P 500 are trading at or above their fair value we may at minimum need to consider the possibility of a slowdown in broad index growth over the coming year. As such, the prudent investor may want to start contemplating other more attractively valued indexes. It would appear that such opportunities lie in Africa. Despite several headwinds such as the effects of the Ebola virus, civil unrest (Boko Harem), the slowdown in the global economy and the drop in the price of oil, Africa remains a resilient continent poised to record around +5% economic growth. In a recent report Yogesh Gokool, head of the AfrAsia Bank explains that this growth will be primarily driven by more foreign direct investments and remittances from non-OECD (Organization for Economic Co-operation and Development) countries that will continue to pour money into corporate acquisitions and large-scale infrastructure projects. Resource rich countries will continue to attract the lion share of FDIs into Africa yet with the drop in the price of oil and rising wages in Asia, manufacturing will also be a significant recipient. The other main driver of growth will be private consumption. In a recent report by the United Nations Economic Commission for Africa entitled African Economic Outlook 2015 it was found that private consumption in Africa is expected to accelerate by 0.5 percentage points to 3.8 percent in 2015 due to consumer confidence and the expanding middle class. Private Consumption and gross capital formation are expected to be key drivers of growth (click to enlarge) Data Source: UN-DESA, 2014 In addition, inflation should remain under control by 0.4 percentage points to 0.7 in 2015. Subdued inflation across economic groupings (click to enlarge) Data Source: UN-DESA, 2014 As for fiscal deficits, the current account balance is expected to decline but remain positive for oil exporting countries while the current account deficit may rise less than expected due to lower oil prices for oil importing countries. Moderating fiscal deficits expected in 2015 among country groupings (click to enlarge) Data Source: EIU, 2014 As mentioned above, certain downside risks could slow economic growth in Africa such as the effects of the Ebola virus, civil unrest (Boko Harem), the drop in oil and commodity prices and a global growth slowdown. Based on early assessments , the economies of Guinea, Liberia, Sierra Leone are experiencing significant hardship as public finances are strained and household incomes are dropping. Nevertheless, the economic impact is not as bad as some feared as the World Bank estimated that Ebola could cost the region as much as $32 billion and the real cost appears to only be a tenth of that figure. In fact, a positive impact of the outbreak seems to be the renewed urgency to reinforce basic public health systems in vulnerable regions. As for lower commodity prices, the negative impact on the continent’s growth may be offset as lower prices will help ease balance of payments pressures in food and energy importing countries while commodity exporting countries face lower export earnings. Furthermore, these commodity declines will serve to reaffirm the benefits of more diversified national economies. Finally, in the face of a potential global slowdown Africa should remain attractive as its economic fundamentals remain sound . Governance and macroeconomic management have improved. Investment in infrastructure, human and physical capital are increasing. Productivity, the middle class and diversified trade are all growing and finally a culture of entrepreneurship is being created. Conclusions Given the risks outlined above and my belief that stable growth in Africa is still a long way off, it may be better to describe investing in Africa as an opportunity for the enterprising investor rather than the prudent investor. Nevertheless, if you remain patient and take a long-term view of an investment in Africa, you may be interested in several ETFs which have African exposure and are currently trading near their 52 week lows. The first is the Market Vectors Africa Index ETF (NYSEARCA: AFK ), which allocates just over a quarter of its weight to developed market countries that do business in Africa. This allocation serves to reduce some of the fund’s exposure to the volatility of local African markets. The fund is heavily weighted to South Africa, Egypt and Nigeria with financials accounting for around 40% of the fund while materials and energy account for around 30%. The other ETF of note is the Guggenheim Frontier Markets ETF (NYSEARCA: FRN ). This fund invests in a collection of small, illiquid and risky markets with great growth potential known as frontier markets . These often high yielding markets have become an asset class in their own right and the fund’s exposure to Africa is only about 13%, with the rest allocated to other markets in Latin America.