Watch Your Step When Using Bond Ladder ETFs
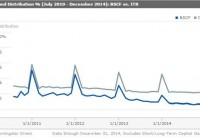
By Thomas Boccellari Institutional investors, such as insurance companies and pension plans, have long used their bond portfolios to match their interest and principal repayments with their cash flow needs. One way to accomplish this is to construct a portfolio of bonds with different maturity dates that correspond with the investor’s obligations. This is known as a bond ladder, and it can help mitigate interest-rate and liquidity risk. However, building a bond ladder can be expensive and time-consuming. Because bonds are traded over the counter, bid-ask spreads may be wide. Additionally, brokerage firms can charge high commissions for bond trades. Bond ladder exchange-traded funds can help solve some of these problems. Because bond ladder ETFs, such as Guggenheim Investment’s BulletShares and iShare’s iBonds, hold bonds from upwards of 100 different issuers, credit risk is more evenly spread around a portfolio. Further, because they don’t have lofty purchase minimums, like many bonds available through a broker, investors can get exposure to a variety of different bonds with very little capital. Strategies for Using Bond Ladder ETFs Within a Portfolio Suppose an investor knows that she will need to pay for a wedding and a down payment on a new home in one and three years, respectively. The investor may wish to set aside a certain amount of capital to pay for those future obligations. In the meantime, however, the investor would like to collect interest on her capital. If the investor buys a traditional bond mutual fund or ETF, she runs the risk of not getting back her original investment because of potential interest-rate movements that could push bond prices lower. To mitigate this risk, she could buy iShares iBonds September 2016 AMT-Free Municipal Bond (NYSEARCA: IBME ) and iShares iBonds September 2018 AMT-Free Municipal Bond (NYSEARCA: IBMG ) to match her portfolio’s maturity dates with her corresponding spending needs. This would allow her to collect income while getting her full investment principal back to pay for her obligations. Laddered bond ETFs also give investors better control over their portfolio duration, or interest-rate sensitivity. For example, suppose an investor wants exposure to investment-grade corporate bonds but is afraid that a traditional corporate-bond ETF, such as SPDR Barclays Intermediate Term Corporate Bond ETF (NYSEARCA: ITR ) , has too much exposure to bonds maturing between five and 10 years from now and is too exposed to interest-rate movements. To mitigate this risk, she could use Guggenheim BulletShares 2015/2016/2017/2018 Corporate Bond ETF (NYSEARCA: BSCF ) / (NYSEARCA: BSCG ) / (NYSEARCA: BSCH ) / (NYSEARCA: BSCI ) to give an overweighting to bonds with maturities of less than five years from now and reduce her portfolio’s overall exposure to interest-rate risk. Bond Ladder ETF structure Like an individual bond, a bond ladder ETF has a predefined maturity date. The fund can do this because it only buys bonds maturating in the year the ETF terminates. For example, Guggenheim BulletShares 2015 Corporate Bond ETF ( BSCF ) tracks an index that targets investment-grade corporate bonds maturing in 2015. The fund terminates (matures) on Dec. 31, 2015. At maturity, the fund’s assets are returned to investors. Because the fund has a predefined maturity date, it will behave differently from traditional bond ETFs. A traditional bond ETF targets a consistent range of bonds. For example, ITR targets U.S. dollar-denominated bonds with maturities between one and 10 years. During the fund’s monthly rebalancing, it will buy new bond issuances that have maturities between one and 10 years and sell bonds that no longer meet the maturity requirement. This keeps the fund’s duration relatively consistent. On the other hand, a laddered bond ETF only replaces bonds that are called. Otherwise, it holds securities until maturity or the fund’s termination date, which is usually in the same year that all of its bonds mature. This means that the laddered bond ETF’s duration will decline as the fund approaches maturity. While one would expect a laddered bond ETF to make consistent interest payments throughout its life, like an individual bond, this has not been the case. In fact, for funds within the BulletShares and iBonds families, monthly distributions have decreased at a similar rate to that of a traditional bond fund over the trailing five years through December 2014. Laddered bond ETFs’ inclusion of callable bonds could help explain this. Issuers can buy (call) back callable bonds if their price exceeds a predetermined level, which typically occurs when interest rates fall. The fund then has to replace these bonds with lower-yielding alternatives. Callable bonds are not the only problem. Companies have also refinanced their debt because of prolonged low interest rates. This has the same effect as when a bond is called. Further, if a bond matures, is called, or is redeemed after the final rebalancing, the bond is not reinvested in a corporate bond. It is instead kept in Treasury bills until the fund terminates. For Guggenheim BulletShares, the final rebalancing date is July 1 of the termination year. Therefore, if a bond matures, is called, or is redeemed after July 1 of the fund’s termination year, investors will lose more interest and not have the ability to reinvest their principal. This also means that investors won’t get back exactly their original principal plus interest because not all bonds are held until the fund’s maturity. At the start of 2014, BSCF had 285 bonds. By the end of 2014, 23 bonds dropped out because they were called or redeemed early. This had an impact on the fund’s distribution amount. Over the life of the fund, it saw its distribution percentage decline in a similar fashion to that of ITR. The difference in distribution percentage between BSCF and ITR is roughly equivalent to the difference in the funds’ expense ratios. Distributions are higher in December of each year because both funds include both the December and January distributions in December. Lastly, investors need to be aware of the additional costs associated with buying additional funds. If an investor decides to build a five-bond ladder, there will be at least five transactions. These costs can also increase if investors decide to roll their terminated ETFs’ assets into new funds. For investors who are comfortable with the structural risks of these funds, they are a cheaper, easier to build, and safer alternative to individual bond ladders. But traditional bond ETFs may be a better choice for investors looking for aggregate exposure to a particular type of bond or maturity range. Disclosure: Morningstar, Inc. licenses its indexes to institutions for a variety of reasons, including the creation of investment products and the benchmarking of existing products. When licensing indexes for the creation or benchmarking of investment products, Morningstar receives fees that are mainly based on fund assets under management. As of Sept. 30, 2012, AlphaPro Management, BlackRock Asset Management, First Asset, First Trust, Invesco, Merrill Lynch, Northern Trust, Nuveen, and Van Eck license one or more Morningstar indexes for this purpose. These investment products are not sponsored, issued, marketed, or sold by Morningstar. Morningstar does not make any representation regarding the advisability of investing in any investment product based on or benchmarked against a Morningstar index.