Tag Archives: function

Consumer Staples ETF: XLP No. 4 Select Sector SPDR In 2014
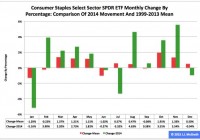
Summary The Consumer Staples exchange-traded fund finished fourth by return among the nine Select Sector SPDRs in 2014. Along the way, the ETF had a big up month in November (5.54 percent) and a big down month in January (-5.16 percent). Seasonality analysis indicates the fund could have a tough first quarter. The Consumer Staples Select Sector SPDR ETF (NYSEARCA: XLP ) in 2014 ranked No. 4 by return among the Select Sector SPDRs that chop the S&P 500 into nine morsels. On an adjusted closing daily share-price basis, XLP ascended to $48.49 from $41.90, a climb of $6.59, or 15.73 percent. Accordingly, it led its parent proxy SPDR S&P 500 Trust ETF (NYSEARCA: SPY ) by 2.26 percentage points and lagged its sibling Utilities Select Sector SPDR ETF (NYSEARCA: XLU ) by -13.01 points. (XLP closed at $48.96 Monday.) XLP ranked No. 3 among the sector SPDRs in the fourth quarter, when it behaved better than SPY by 3.36 percentage points and worse than XLU by -4.92 points. And XLP ranked No. 7 among the sector SPDRs in December, when it performed worse than XLU and SPY by -4.52 and -0.69 percentage points, in that order. Figure 1: XLP Monthly Change, 2014 Vs. 1999-2013 Mean (click to enlarge) Source: This J.J.’s Risky Business chart is based on analyses of adjusted closing monthly share prices at Yahoo Finance . XLP behaved a lot better in 2014 than it did during its initial 15 full years of existence based on the monthly means calculated by employing data associated with that historical time frame (Figure 1). The same data set shows the average year’s weakest quarter was the first, with a relatively small negative return, and its strongest quarter was the fourth, with an absolutely large positive return. Generally consistent with this pattern, the ETF had a huge gain in the fourth quarter last year. Figure 2: XLP Monthly Change, 2014 Versus 1999-2013 Median (click to enlarge) Source: This J.J.’s Risky Business chart is based on analyses of adjusted closing monthly share prices at Yahoo Finance. XLP also performed a lot better in 2014 than it did during its initial 15 full years of existence based on the monthly medians calculated by using data associated with that historical time frame (Figure 2). The same data set shows the average year’s weakest quarter was the first, with a relatively small positive return, and its strongest quarter was the fourth, with an absolutely large positive return. Clearly, this means there is no historical statistical tendency for the ETF to explode in Q1. Figure 3: XLP’s Top 10 Holdings and P/E-G Ratios, Jan. 9 (click to enlarge) Note: The XLP holding-weight-by-percentage scale is on the left (green), and the company price/earnings-to-growth ratio scale is on the right (red). Source: This J.J.’s Risky Business chart is based on data at the XLP microsite and FinViz.com (both current as of Jan. 9). It is an article of faith (and statistical interpretation) hereabouts that so-called PUV analysis is better than psychoanalysis in determining Mr. Market’s state of mind. So what is PUV analysis? It is basically the study of the behaviors of XLP, XLU and the Health Care Select Sector SPDR ETF (NYSEARCA: XLV ) in comparison with their sibling Select Sector SPDRs. If the PUV cluster of ETFs ranks in or near the top third of the sector SPDRs by return during a given period, then I believe market participants are in risk-off mode; if the PUV cluster of ETFs ranks in or near the bottom third of the sector SPDRs by return over a given period, then I think market participants are in risk-on mode. Given the relative performances of the low-beta PUV cluster members (aka XLP, XLU and XLV) that led them to finish in three of the top four spots among the sector SPDRs last year, I believe market participants were in risk-off mode. And I think they will continue to be so this year, with changes in policy at the U.S. Federal Reserve the biggest reason why. Despite the long-term sector rotation into the PUV cluster at this late stage of the economic/market cycle, the valuations of XLP’s top 10 and other holdings may be a drag on the ETF’s price appreciation in the foreseeable future (Figure 3). Numbers reported by S&P Senior Index Analyst Howard Silverblatt supported this hypothesis Dec. 31, when he pegged the P/E-G ratio of the S&P 500 consumer-staples sector at 2.12, which is pretty rich for the blood of at least one PUV analyst (i.e., me). Disclaimer: The opinions expressed herein by the author do not constitute an investment recommendation, and they are unsuitable for employment in the making of investment decisions. The opinions expressed herein address only certain aspects of potential investment in any securities and cannot substitute for comprehensive investment analysis. The opinions expressed herein are based on an incomplete set of information, illustrative in nature, and limited in scope. In addition, the opinions expressed herein reflect the author’s best judgment as of the date of publication, and they are subject to change without notice.

Cohen & Steers REIT And Preferred Income Fund: Not Just A Real Estate Offering

Summary RNP is managed by REIT specialist Cohen & Steers. RNP does not, however, have a strict real estate focus. It might be better to look at RNP as a balanced fund of sorts. Cohen & Steers REIT and Preferred Income Fund (NYSE: RNP ) is an interesting animal that tries to combine in one fund two different investment focuses. For investors seeking simplicity, this could be a good option. For those who want more control over their portfolios, you’d be better off buying a real estate investment trust (REIT) fund and a preferred fund separately. Who is Cohen & Steers? I always include a comment about this company’s origin when I write about it because Cohen & Steers isn’t a household name in finance. But it is one if you are remotely connected to the REIT space. That’s because Martin Cohen and Robert Steers were among the first to create a company dedicated to investing in REITs. They basically helped popularize the space for institutional and individual investors. And, more important, the company they created has lots of experience. If you are thinking about outsourcing your REIT investments to anyone, Cohen & Steers should be on your short list. So, from that standpoint, I like anything they do that involves real estate investing. Only half the fund But that’s only half of what Cohen & Steers REIT and Preferred Income Fund does. The other half of the fund invests in preferred shares. While there’s some overlap, since REITs often issue preferred shares, that doesn’t make Cohen & Steers an expert in, say, preferreds issued by insurance companies. That’s not to suggest that they don’t have the ability to do analyze such securities, just that their business has historically been structured around REITs. And this fund, with only about 10% of its preferred portfolio in REIT preferreds, is definitely more than just REITs. But what exactly is in RNP? Roughly 50% of the fund is, indeed, in REITs. The largest holdings are basically top-quality players. It’s fairly diversified across nine major sectors, with offices, apartments, and regional malls accounted for nearly half of its real estate exposure. Nothing exciting here. Preferred stocks and debt make up the rest of the fund. That side is concentrated in four sectors. Banking preferred stocks alone make up nearly 55% of this side of the portfolio. Insurance, real estate, and utility preferreds are the other big areas. This speaks more to the nature of the preferred market than to anything else, since these group of industries tends to make the most use of preferred stock. It’s worth taking note of the real estate sector’s 10% position on this half of the fund, which means that REITs, in some form, make up about 55% of RNP’s overall portfolio. The big takeaway from that is that this is not a pure real estate investment trust fund. It was never intended to be, but you should keep this fact in the back of your mind if you own it and front and center if you are looking for a pure REIT fund. How’s it done? Looking at total return, which includes distributions, RNP’s trailing ten year return through year-end 2014 was roughly 8% based on the share price (a little under 7% based on the CEF’s net asset value) according to Morningstar. That’s not bad for a fund with an income focus and is roughly in line with the S&P 500 Index over that span. That, of course, assumes the reinvestment of dividends. The price of RNP is down roughly 30% over that span if you used the dividends. Note, however, that dividends over the last six years have totaled roughly seven dollars or so. That pretty much makes up for the entire share price decline right there. While it’s true that the shares are worth less, you have been paid reasonably well along the way… With the other four years of dividends providing the bulk of your take-home return over the span. So, overall, this is a fine fund if you want a decently performing REIT and preferred combo offering. But you’ll need to keep another factor in mind. The big problem RNP makes use of leverage. Toward the end of last year, the fund’s leverage was at around 27%. Leverage is a double-edge sword, aiding performance in good markets and exacerbating losses in bad ones. For example, in 2007 the fund’s return was -27%, according to Morningstar. In 2008 it returned -60%. Those are hard losses to watch unfold and include dividend payments. That said, in 2009 RNP was up 90%, including dividends, and in 2010 it advanced another 50%. So while the fund owns what some would consider “safer” investments, this fund is anything but conservative. This is a fact that shouldn’t be taken lightly. Note, too, that the fund’s inherent exposure to financial preferred stocks on the preferred side of the portfolio were a huge drag during the financial-led 2007 to 2009 recession, when the CEF was hard hit in the market. This type of volatility doesn’t make RNP a bad fund, it just means it’s probably not appropriate for conservative investors. Expenses, meanwhile, at around 1.8%, are elevated by the costs of that leverage. Right now the shares trade at about a 12% discount to NAV. That’s roughly in-line with the fund’s five- and 10-year average discounts of roughly 10%, according to the Closed-End Fund Association. So RNP is hardly on sale right now. But you will be picking up a yield of around 6.75%. At the end of the day The question you have to ask is if that amount of income, most of which has recently been dividend income, is worth the share price volatility that Cohen & Steers REIT and Preferred Income Fund can experience. And the fund is really only appropriate if you want a mix of REIT and preferred exposure in one fund. At the end of the day, I’d say this is a specialty fund most appropriate for those with strong stomachs. It would be a good way, for example, to outsource “boring” sectors and asset classes while still staying true to an aggressive overall investment approach.

Investors Are Scared – Getting Long Volatility Again

Last week I offered up a playbook for volatility for this year. Since that time I’ve shorted volatility and subsequently gotten long. I’ll continue to use a hedged position selling calls against the VXX until the volatility outlook changes. Last week I wrote a piece regarding volatility in the new year and my playbook for how to survive the strong moves up and down in volatility as measure by the short term VIX ETF (NYSEARCA: VXX ). At the time I had no positions as I was waiting for a more definitive move up or down in order to stake my claim on the VXX. I wrote I wanted to see a bigger move up before shorting and since the time the article was published, VXX has moved sharply to the upside to trade near $35 as I write this. So what have I done since the last article and what am I doing going forward? After being out of the VXX for a couple of weeks I actually decided to get short volatility after another move up following my article. I used the inverse short term VIX (NASDAQ: XIV ) ETF to do so to try and capture a move down in the VXX. I went long XIV on the 7th and captured a very nice move down in volatility only to have it reversed on Monday the 12th. After seeing the move down in volatility was short lived I closed my XIV position for a very small gain (after riding the XIV up and back down) and went long VXX again. Why did I go long? There is a lot of stuff going on in the financial world. Oil and other commodities continue to signal that a recession is coming, Greece is once again on the verge of breaking up the Euro and here at home, the market hangs on the Fed’s every word in terms of any potential volatility that could be introduced from the central bank raising rates and pulling stimulus. These factors make me think the likely move in volatility is up in the short term, not down. I’m currently long VXX while selling calls against my position. I did this for two reasons. First, in case I’m wrong, VXX can move down in a hurry and crush you. This is the same problem the short volatility ETFs have and that’s why I trade in and out so much and why you’ve got to be careful. The calls give me some cushion on the downside in exchange for taking away my upside in case volatility collapses. Second, I sold the calls simply because premiums are huge. Slightly out of the money calls can be sold for 5% of the ETFs price – for an option that expires in a week. Think about that one; that kind of yield for five or six trading days is unbelievable and it provides not only huge amounts of cash for your portfolio but a nice bit of protection to the downside. I went long VXX at $33.30 and sold weekly 33 calls against my position for $1.46, expiring four days after I sold them. Given the move up in the VXX to $34.40, I’ve given some upside away but I’m still collecting the huge premium in the meantime, offering 3.5% yield and some downside protection as I sold in the money calls. Given the outlook for continued volatility I think the best course of action going forward is hedged bets in the VXX. Last October and again in December of last year I went long the inverse VXX ETF (NYSEARCA: SVXY ) or the VXX itself with no protection as the situation warranted because I felt strongly I could predict what volatility was doing. But given all of the places we can expect news from in the short term, I don’t feel confident enough to just buy VXX or XIV. I like the covered call play on VXX right now but if VXX spikes to the high $30s, as I said in my last article, I’ll look at doing the same think with XIV. But for now, I’m long VXX until something changes and when it does, I’ll be sure to let you know. Additional disclosure: I’m long VXX hedged with short calls but may trade out of this position at any time.