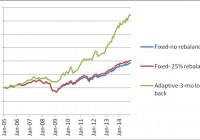
Safe Withdrawal Rates For Retirement Income Portfolios Using Vanguard Mutual Funds
Summary Investment portfolios with good withdrawal rates can be constructed with Vanguard mutual funds. From January 2005 to December 2014, a Vanguard portfolio with fixed allocation could produce a safe 5% annual withdrawal rate and 1.14% annual increase of the capital. Same portfolio with rebalancing at 25% deviation from the target allowed a safe 5% annual withdrawal rate and achieved 1.25% compound annual increase of the capital. Better performance could be achieved using adaptive asset allocation. Same portfolio could have produced a safe 10% annual withdrawal rate and 1.97% annual increase of the capital. The drawdown of the portfolio increases with respect to any increase in the rate of withdrawal. At high withdrawal rates the equity increase reduces substantially. In a previous article , I reported an experiment of the Chicago South Suburban Investment Club with a monthly asset rotation strategy applied to a hypothetic IRA account using five Fidelity mutual funds. The selection of the Fidelity funds was made because many members of the club own IRA accounts with Fidelity. There are many other families of mutual funds that can apply the same methodology to create profitable investment portfolios. In this article, I attempt to build a similar portfolio using Vanguard mutual funds. In the future, I plan to also investigate the applicability of same methods for other mutual fund families such as American Century, Janus, Northern, Schwab, T Rowe Price, Wasatch, etc. To review what was presented in previous articles, the rotation strategy is as follows: on the last trading day of each month, the funds are ranked by the previous 3-month return. All equity is invested in the fund with the highest return, as long as that return is positive. If all the assets had negative returns over the previous 3 months, then all equity is moved into CASH. The five mutual funds considered for investment are the following: Vanguard Intermediate Term Investment Grade Income (MUTF: VFICX ) Vanguard Short Term Investment Grade Income (MUTF: VFSTX ) Vanguard Explorer -small cap growth (MUTF: VEXPX ) Vanguard Windsor II – large cap value (MUTF: VWNFX ) Vanguard Morgan Growth – large cap growth (MUTF: VMRGX ) In this article, three different strategies will be considered: (1) Portfolio is initially invested 20% in each fund without rebalancing. (2) Portfolio is initially invested 20% in each fund and is rebalanced when the allocation to any fund deviates by 25% from its target. (3) Portfolio is at all times invested 100% in only one fund. The switching, if necessary, is done monthly at closing of the last trading day of the month. All money is invested in the fund with the highest return over the previous 3 months. The data for the study were downloaded from Yahoo Finance on the Historical Prices menu for the five tickers, VFICX, VFSTX, VEXPX, VWNFX, and VMRGX. We use the monthly price data from January 2005 to December 2014, adjusted for dividend payments. The paper is made up of two parts. In part I, we examine the performance of portfolios without any income withdrawal. In part II, we examine the performance of portfolios when income is extracted periodically from the account. Part I: Portfolios without withdrawals In table 1 we show the results of the portfolios managed for 10 years, from January 2005 to December 2014. Table 1. Portfolios without withdrawals 2005 – 2014. Strategy Total increase% CAGR% Number trades MaxDD% Fixed-no rebalance 92.50 6.77 0 -35.40 Fixed-25% rebalance 101.80 7.27 3 -35.40 Adaptive 267.36 13.90 48 -14.16 The time evolution of the equity in the portfolios is shown in Figure 1. (click to enlarge) Figure 1. Equities of portfolios without withdrawals. Source: This chart is based on EXCEL calculations using the adjusted monthly closing share prices of securities. From figure 1, it is apparent that the rate of increase of the adaptive portfolio is substantially greater than the rate of the fixed allocation portfolios. Part II: Portfolios with withdrawals Assume that we invest $1,000,000 for income in retirement. We plan to withdraw monthly a fixed percentage of the initial investment. That amount is increased by 2% annually in order to account for inflation. In table 2, we show the results of the portfolios managed for 10 years, from January 2005 to December 2014. Money was withdrawn monthly at a 5% annual rate of the initial investment plus a 2% inflation adjustment. Over the 10 years from January 2005 to December 2014, a total of $535,920 was withdrawn. Table 2. Portfolios with 5% annual withdrawal rate 2005 – 2014. Strategy Total increase% CAGR% Number trades MaxDD% Fixed-no rebalance 12.00 1.14 0 -39.19 Fixed-25% rebalance 13.24 1.25 4 -39.96 Adaptive 144.46 9.35 48 -20.98 The time evolution of the equity in the portfolios is shown in Figure 2. (click to enlarge) Figure 2. Equities of portfolios with 5% annual withdrawal rates. Source: This chart is based on EXCEL calculations using the adjusted monthly closing share prices of securities. To illustrate better the advantage of the adaptive allocation strategy and the effect of withdrawal rates on the evolution of the capital, we give in Table 3 the results of simulations for the following withdrawal rates: 0%, 5%, 6%, 8%, 10%, and 12%. Table 3. Adaptive Portfolios with various annual withdrawal rates 2005 – 2014. Withdrawal rate % Total increase% CAGR% MaxDD% 0 267.36 13.90 -14.16 5 144.46 9.35 -20.98 6 119.88 8.20 -22.53 8 70.72 5.49 -25.88 10 21.55 1.97 -29.70 Important observations can be made by analyzing the results posted in Table 3. At the safe withdrawal rate of 5%, the increase of the equity of the account is still significant resulting in a CAGR of 9.35%, a reduction of only 4.55%. On the other hand, by increasing the withdrawal rate by another 5% results in a CAGR of 1.97%, an additional reduction of 7.38%. The maximum drawdown increases quickly with any increase in the withdrawal rate. At the safe 5% withdrawal rate, the resulting drawdown increases with 6.82% which is comparable with the withdrawal rate. At higher withdrawal rates, the increase of the drawdown becomes dramatic, leading eventually to the quick depletion of the account. Conclusion The adaptive allocation algorithm performed substantially better than the fixed allocation algorithms. The fixed allocation strategies allow a safe withdrawal rate of 5% at any time horizon between 2005 and 2014, without a substantial decrease of capital. The adaptive allocation algorithm allows a 5% annual withdrawal rate while assuring a substantial increase of capital. In fact, the momentum-based adaptive allocation strategy allows a safe 10% annual rate of withdrawal without any decrease of capital.