Tag Archives: function

Dividend Growth Stock Overview: Aqua America, Inc.

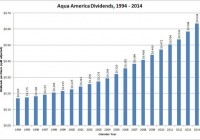
Summary Aqua America provides water and wastewater services to 3 million customers across 8 states. The company seeks to grow through acquisitions; it completed 13 acquisitions in 2014. Aqua America has increased dividends for 22 years, and over the past 5 years, it has grown dividends at an average rate of nearly 7.6%. About Aqua America Aqua America (NYSE: WTR ) is a holding company that, through its subsidiaries, provides water and wastewater utilities to 3 million customers across 8 states. The company owns and operates over 1,440 public water systems, and 187 wastewater treatment plants and collection systems. Aqua America originated as the Springfield Water Company in 1886 when a group of Swarthmore College professors were granted a charter to supply water to residents of Springfield Township, PA. Having started in Pennsylvania, half of Aqua America’s customers are in that state with the remaining customers distributed over Illinois, Indiana, New Jersey, North Carolina, Ohio, Texas and Virginia. Aqua America’s strategic objective is to grow in the fragmented water utility industry through acquisitions. The company completed 13 acquisitions in 2014. The most recent acquisitions were the Caroline Water Company, which serves 3,000 people in Caroline County, VA; Texas H2O which serves 3,300 customers in the suburbs of the Dallas-Fort Worth metropolitan area; and the Spartan Village water and wastewater systems – serving 650 customers – from the New Jersey village government. In 2013, the last year for which full-year figures are currently available, Aqua America’s income was $221.3 million, up 12.6% from 2012; and its income per share was $1.25, up 11.6% from 2012. Aqua America’s customer base was up 1.3% to 941,000 customers. One area of concern is the company’s high level of debt. At the end of 2013, Aqua America had $1.5 billion in long-term, fixed-rate debt with an average interest rate of 5%. Another area of concern is the degree to which Aqua America’s organic income growth is dependent on rate increases granted by local and state regulatory authorities. The company is a member of the S&P Mid Cap 400 index and the S&P’s High Yield Dividend Aristocrats index, and trades under the ticker symbol WTR. Aqua America, Inc.’s Dividend and Stock Split History (click to enlarge) Aqua America has paid quarterly dividends since 1944 and increased dividends annually since 1992. Last year, Aqua America announced a dividend increase of 8.6%, from 15.2 cents to 16.5 cents per share, at the beginning of August. The stock went ex-dividend with the increased dividend in mid-August. I expect Aqua America to announce its next dividend increase in early August 2015. Aqua America has a history of moderate dividend increases, with annual dividend growth in the mid-single digit percentages. From 2009-2014, Aqua America grew its dividend from 44 cents to 63.4 cents per share, for a 5-year compounded annual dividend growth rate (CADGR) of 7.58%. Aqua America’s 10-year and 20-year CADGRs are 7.99% and 6.83%, respectively. Aqua America has split its stock eight times since 1986. In September 1986 and June 1996, Aqua America conducted 3-for-2 stock splits. This was followed by a 4-for-3 stock split in January 1998, and 5-for-4 stock splits in December 2000, December 2001, and December 2003. In December 2005, Aqua America split its stock again, this time 4-for-3. And most recently, the company split its stock 5-for-4 in September 2013. Over the 5 years ending on December 31, 2014, Aqua America stock appreciated at an annualized rate of 16.93%, from $12.22 to $26.70. This beat both the 13.0% annualized return of the S&P 500 and the 14.9% annualized return of the S&P Mid Cap 400 index during this time. Direct Purchase and Dividend Reinvestment Plans Aqua America has both direct purchase and dividend reinvestment plans. The company has created a very favorable pair of plans for investors. The company pays nearly all of the fees associated with purchasing stock, including through dividend reinvestment. There are no fees to setup an account, or to purchase stock – either directly or through dividend reinvestment. The minimum investment for new accounts is $500, either in a single purchase or in 10 monthly installments of at least $50 each. The plan permits both purchases by check or automatic debit. The most attractive feature of Aqua America’s dividend reinvestment plan is the discount. The company currently offers a 5% discount on the purchase price of shares bought through the dividend reinvestment plan. This will reduce your cost basis and is taxable, but is extremely beneficial to you as an investor. Aqua America is one of a very few companies that offers shares purchased through dividend reinvestment at a discount to the market price. Finally, when you go to sell your shares in the plan, you’ll pay a transaction fee of either $15 or $25, depending on the type of sell order you request. You’ll also pay an additional fee of 12 cents per share sold. Furthermore, if you place your sell order through a representative on the phone, you’ll pay an additional fee of $15. Helpful Links Aqua America, Inc.’s Investor Relations Website Current quote and financial summary for Aqua America, Inc. (finviz.com) Information on the direct purchase and dividend reinvestment plans for WTR

ETF Securities Expands Equity ETF Lineup With Two More New Funds

ETF Securities is expanding its line of factor-based equity ETFs. A closer look at the two new smart-beta, index-based ETFs. Based off ERI Scientific Beta indexing methodologies. ETF Securities, the London-based exchange-traded funds issuer known primarily for its lineup of commodities funds, is again adding to its lineup of U.S.-listed equity-based offering with the debuts of the ETFS Diversified-Factor U.S. Large Cap Index Fund (NYSEARCA: SBUS ) and the ETFS Diversified-Factor Developed Europe Index Fund (NYSEARCA: SBEU ) . ETF Securities is partnering with ERI Scientific Beta on the new ETFs. Scientific Beta is an index provider specializing in smart beta solutions and is part of the EDHEC-Risk Institute, an entity that works closely with institutions to implement academic research and improve their investment and risk management process, according to a statement . Scientific Beta’s stock selection process includes emphasizing investment factors, such as volatility, valuation, momentum and size. Factor-based funds are one of the fastest-growing segments of the ETF universe. The quality factor alone is the cornerstone of nearly 30 ETFs and issuers continue to bring an array of factor-driven ETFs to market. Since the start of 2015, JPMorgan introduced the JPMorgan Diversified Return Emerging Markets Equity ETF (NYSEARCA: JPEM ) , a multi-factor emerging markets ETF while iShares added two international ETFs to its factor-based suite. The ETFS Diversified-Factor U.S. Large Cap Index Fund tracks the Scientific Beta United States Multi-Beta Multi-Strategy Equal Weight Index, which “uses a proprietary weighting strategy to provide well diversified exposure, by combining 5 models: Maximum Deconcentration, Maximum Decorrelation, Efficient Minimum Volatility, Efficient Maximum Sharpe Ratio, and Diversified Risk Weighted,” according to ETF Securities . Financial services is the largest sector weight in SBUS at 19.2% followed by consumer cyclicals at 13.9%. No stock accounts for more than 0.72% of the new ETF’s weight. Top 10 holdings include CareFusion (NYSE: CFN ), Annaly Capital (NYSE: NLY ) and Dow component Merck (NYSE: MRK ). The ETFS Diversified-Factor Developed Europe Index Fund tracks the Scientific Beta Developed Europe Multi-Beta Multi-Strategy Equal Weight Index, which “is composed of the 700 largest and most liquid stocks listed in the following countries: Austria, Belgium, Denmark, Finland, France, Germany, Greece, Ireland, Italy, The Netherlands, Norway, Portugal, Spain, Sweden, Switzerland and the United Kingdom,” according to ETF Securities . The ETF currently holds 476 stocks, nearly a third of which are U.K. companies. France and Germany combine for over 23% of the new ETF’s weight. Top sector weights include 22.6% to financial services, 17% to industrials and 13.3% to consumer cyclicals. Both new ETFs charge 0.4% per year. SBUS and SBEU debuted on the heels of ETF Securities’ initial forays into U.S.-listed equity ETFs. Those ETFs, the ETFS Zacks Earnings Large-Cap U.S. Index Fund (NYSEARCA: ZLRG ) and the ETFS Zacks Earnings Small-Cap U.S. Index Fund (NYSEARCA: ZSML ) launched last week. ETF Trends editorial team contributed to this post.

XLF: How Would The Financial Select Sector ETF Fit In My Portfolio?

I’ll take a look at XLF to see if it makes sense for me. The liquidity is fantastic, but the description of the holdings sounded more diversified than the actual holdings in the portfolio. The ETF looks very solid for investors that have a large enough portfolio to make it worth investing a small percentage. The holdings aren’t bad, and the expense ratio looks very appealing. Investors should be seeking to improve their risk adjusted returns. I’m a big fan of using ETFs to achieve the risk adjusted returns relative to the portfolios that a normal investor can generate for themselves after trading costs. I’m working on building a new portfolio and I’m going to be analyzing several of the ETFs that I am considering for my personal portfolio. One of the funds that I’m considering is the Financial Select Sector SPDR ETF (NYSEARCA: XLF ). I’ll be performing a substantial portion of my analysis along the lines of modern portfolio theory, so my goal is to find ways to minimize costs while achieving diversification to reduce my risk level. What does XLF do? XLF attempts to track the total return (before fees and expenses) of the Financial Select Sector Index. Substantially all of the assets (at least 95%) are invested in funds included in this index. XLF falls under the category of “Financial.” It sounds like the ETF would be very highly concentrated, but it includes everything from diversified financial services to REITs and banks. When I was first reading about the holdings, I was expecting more diversification than I found. You’ll see what I mean when I get to the holdings section. Does XLF provide diversification benefits to a portfolio? Each investor may hold a different portfolio, but I use the SPDR S&P 500 Trust ETF (NYSEARCA: SPY ) as the basis for my analysis. I believe SPY, or another large cap U.S. fund with similar properties, represents the reasonable first step for many investors designing an ETF portfolio. Therefore, I start my diversification analysis by seeing how it works with SPY. I start with an ANOVA table: (click to enlarge) The correlation is just over 91%. That’s a strong correlation and substantially higher than I would expect for the REITs inside the ETF. I’m expecting the banks may be pushing the correlation higher. As an investor using modern portfolio theory, I can still work with 91%. Of course, the computed correlation wouldn’t mean much if the values were being distorted by poor liquidity. The average volume of more than 40 million shares per day suggests that liquidity shouldn’t be a concern. That’s a good sign for investors wanting verification of the statistics or wanting to know that they can exit the position with less concern about it deviating from NAV. Standard deviation of daily returns (dividend adjusted, measured since November 2013) The standard deviation is a bit high, but not absurd. For XLF it is .939%. For SPY, it is 0.736% for the same period. The ETF is definitely showing more volatility than SPY by a noticeable margin when we compare returns on a daily basis. Given the fairly strong correlation, I’m not expecting the ETF to be able to lower the risk level in the portfolio. Mixing it with SPY I run comparisons on the standard deviation of daily returns for the portfolio assuming that the portfolio is combined with the S&P 500. For research, I assume daily rebalancing because it dramatically simplifies the math. With a 50/50 weighting in a portfolio holding only SPY and XLF, the standard deviation of daily returns across the entire portfolio is 0.819%. With 80% in SPY and 20% in XLF, the standard deviation of the portfolio would have been .763%. If an investor wanted to use XLF as a supplement to their portfolio, the standard deviation across the portfolio with 95% in SPY and 5% in XLF would have been .742%. As expected, even solid diversification can’t quite eliminate the additional volatility. However, that does not necessarily indicate that there is anything wrong with the ETF. 40 million shares don’t trade hands without plenty of buyers. Why I use standard deviation of daily returns I don’t believe historical returns have predictive power for future returns, but I do believe historical values for standard deviations of returns relative to other ETFs have some predictive power on future risks and correlations. Yield & Taxes The distribution yield is 1.61%. The SEC yield is 1.52%. I like to see strong yields for retiring portfolios because I don’t want to touch the principal. By investing in ETFs I’m removing some of the human emotions, such as panic. Higher yields imply lower growth rates (without reinvestment) over the long term, but that is an acceptable trade off in my opinion. The yield is a little low for those purposes, but not low enough to make it unworkable. Expense Ratio The ETF is posting an expense ratio of .16%. I want diversification, I want stability, and I don’t want to pay for them. An expense ratio of .16% is great. I’ve got no issues there. That’s a very reasonable expense ratio to pay on the ETF. Market to NAV The ETF is at a .01% premium to NAV currently. Premiums or discounts to NAV can change very quickly so investors should check prior to putting in an order. For the extremely high volume of shares trading hands, I would expect the NAV and price to move hand in hand. Largest Holdings The diversification in the holdings isn’t going to be a strong selling point. I certainly don’t mind Berkshire Hathaway as a top holding, but to me this remains a bank ETF. The biggest REIT position is Simon Property Group (NYSE: SPG ). I have nothing against SPG, but it is also the biggest REIT position in most REIT ETFs. I like REIT ETFs, and I’m planning to use one or two in my portfolios. I don’t see much reason to get the same stock in the bank ETF, but with an expense ratio of only .16% it isn’t like I’d be getting charged much for holding it. (click to enlarge) Conclusion The correlation is a bit high, but given the major holdings I can’t expect anything less. I’m not overly bullish on the bank industry at the moment, but I’m not going to focus my ETF selections on my short term feelings about an industry. While I’m concerned about regulatory pressures, my concerns should already be priced into the stocks. For investors looking at the very long term picture, the extremely low expense ratio is great. When I’m putting together hypothetical portfolio positions, one of the things I include is the expense ratio of the ETFs to track the overall expense ratio on the portfolio. In that regard, I think XLF would do quite nicely. During my three year sample period the ETF did thoroughly outperform SPY. I wouldn’t count on it to happen again, but I would consider it as a significant possibility. Since I believe my regulatory concerns are already factored into the share prices for the major banks, I think the ETF would make a solid fit. The only real challenge I have in using the ETF is that I would want to limit the position to 5% of the portfolio. When the goal of the ETF portfolio is to minimize trading costs while maximizing diversification, investors have an incentive to avoid using ETF’s that are most suitable for small positions unless they have a way to trade it with no commissions. If I had a way to trade this ETF with no commissions, I’d probably put it in my portfolio. As it stands, paying the trading costs for 5% of the portfolio doesn’t offer enough benefits for me. Without substantial diversification benefits, I’m more likely to just use the extra money to buy more shares of the Vanguard Total Stock Market ETF (NYSEARCA: VTI ). When my portfolio grows to the point that it is worth separating out another 5%, I may take another look at XLF. It’s a solid ETF that just doesn’t happen to be the right match for my smaller portfolio. Disclosure: The author has no positions in any stocks mentioned, and no plans to initiate any positions within the next 72 hours. The author wrote this article themselves, and it expresses their own opinions. The author is not receiving compensation for it (other than from Seeking Alpha). The author has no business relationship with any company whose stock is mentioned in this article. Additional disclosure: Information in this article represents the opinion of the analyst. All statements are represented as opinions, rather than facts, and should not be construed as advice to buy or sell a security. Ratings of “outperform” and “underperform” reflect the analyst’s estimation of a divergence between the market value for a security and the price that would be appropriate given the potential for risks and returns relative to other securities. The analyst does not know your particular objectives for returns or constraints upon investing. All investors are encouraged to do their own research before making any investment decision. Information is regularly obtained from Yahoo Finance, Google Finance, and SEC Database. If Yahoo, Google, or the SEC database contained faulty or old information it could be incorporated into my analysis. The analyst holds a diversified portfolio including mutual funds or index funds which may include a small long exposure to the stock.