Tag Archives: function

VNQI: International Equity REITs Yielding 3.85%

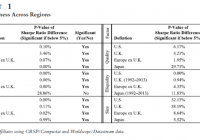
Summary VNQI is a far better method for international equity than buying ADRs. The Vanguard Global ex-U.S. Real Estate ETF has everything most investors would want. Intense diversification combined with strong yields. Investors need to consider the bid-ask spread when buying into an ETF, even if they are holding it for the long term. Investors need international exposure and in my opinion the best way to get that exposure is through diversified ETFs with very low expense ratios. One of the ETFs that I am personally using for my international exposure is the Vanguard Global ex-U.S. Real Estate ETF (NASDAQ: VNQI ) and I can tell you from personal experience I like the investment much better than equity investments where the ADRs (American Depositary Receipts) are charging me fees for holding the equity. Previously, those fees could only be deducted from dividends so I made the unwise move of making an equity investment through ADRs that had no dividend. If you want to know more about ADRs, read this article from Charles Schwab . The ADR is awful After the changes to allow agents to collect fees even if the underlying security did not pay a dividend, I found I had the single worst type of “investment”. This is the kind of “investment” that pulls money out of your pocket instead of putting money in. It’s like a negative dividend, and I’m less than thrilled about it. I’ve held onto that stock so I could time the sale for a tax loss and it looks like this year will be the year to do it. Due to how large the tax loss will be, I will be reaping it for years to come. I could sell smaller positions each year rather than carrying the loss across multiple years, but I’m not fond of holding any security with a negative dividend. Vanguard Global ex-U.S. Real Estate ETF is excellent Instead of providing negative cash flows, the Vanguard Global ex-U.S. Real Estate ETF is offering investors a distribution yield of 3.85%. I like the yield, I like the business model of equity REITs, and I like Vanguard as the manager of the fund for a couple reasons. Reason 1: Opaque When an ETF is going to be investing in securities that are even remotely illiquid, I would like to see some opaqueness. Vanguard does not regularly update the holdings of their ETFs and makes it more difficult for investors to know precisely what is inside the ETF. By making it more difficult for institutional investors to know what stocks will be bought and sold by the ETF, Vanguard is able to discourage front-running of their trades. If someone was able to effectively front-run the Vanguard trades, they would make some serious profits and the returns to holders of the Vanguard ETF would be marginally reduced. Even if the reduction is marginal, I don’t want any reduction in my returns. It is extremely rare that I will endorse a strategy that is more opaque, but Vanguard is one of the few companies that earned my respect over the years. It is difficult to earn my respect and very easy to lose it. I’m holding a significant portion of my portfolio in Vanguard ETFs and I trust them to be acting the best interests of the shareholders. Reason 2: Diversification Vanguard Global ex-U.S. Real Estate ETF offers investors excellent diversification through having a total of 632 holdings. Only 23.1% of the value of the ETF was invested in the top ten holdings. Only two countries represent more than 10% of the portfolio, those are Japan at 22.7% and Hong Kong at 10.8%. Reason 3: Correlation My other international investment is the Schwab International Equity ETF (NYSEARCA: SCHF ). In my opinion, SCHF is one of the best international investments available today. I’m adding to my position in SCHF to increase the international exposure of my portfolio. Vanguard Global ex-U.S. Real Estate ETF offers moderately high levels of correlation with the Schwab International Equity ETF. However, most diversified international investments show high correlation to each other. Compared to the level of correlation that I see on other international funds, the correlation for VNQI isn’t too bad. Reason 4: Bid-Ask spread When you’re buying into a position in an ETF, you’re usually stuck paying the spread. If you intend to hold the investment indefinitely, you may only need to cross the spread once. Even if you only cross the spread once, it can be a meaningful reduction in your portfolio value if the spread is significant. As I have been writing this article I checked live updates on the bid and ask for VNQI a couple times. I’ve seen the spread range from $.01 to $.03. Share prices were running around $57, so we are looking at a range of around .02% to .05% being lost to the spread. Over the long term, it is usually assumed that you would lose half the spread going in and half the spread going out. I don’t like selling long term investments with solid dividend yields, so when I buy an ETF I intend to hold it for a long time. If you don’t want the ETF in 2025, why buy it now? Reason 5: I love dividends This ETF is offering solid yields on the portfolio which is the antithesis of the negative yield on ADRs. If an investor is investing for the long term, they would be wise to look at the yield they are buying and focus on acquiring income that is both respectable in volume and highly diversified in nature. That makes VNQI a very reasonable addition to most portfolios. It offers a strong yield to go with heavily diversified holdings. Conclusion When investors need international exposure, VNQI is one of the solid options to do it. There are several factors for the ETF and only a few against it. In my opinion, the biggest drawbacks are the expense ratio and the exposure to China (around 8.28% in China). The expense ratio of .24% is much lower than competitors offering international REIT exposure, but it is also much higher than the expense ratios on any of my other ETFs. Different people build their wealth in different ways. My method was being very frugal with my money. One way that I demonstrate that frugal stance is in limiting my exposure to high expense ratios. I’m not as big on the exposure to China because I think the Chinese economy is in a bubble and I don’t want that bubble in my portfolio. To avoid that bubble, my new holdings for international exposure (outside of dividend reinvestment) will be made in the Schwab International Equity ETF. I’m more comfortable with SCHF’s allocation by country than I am with VNQI. Even though I’m focusing on acquiring more SCHF, I’m going to continue holding my shares in VNQI. I think VNQI is a solid choice for part of the international exposure in the portfolio of a tax advantaged investor. Disclosure: The author is long VNQ, SCHF. (More…) The author wrote this article themselves, and it expresses their own opinions. The author is not receiving compensation for it (other than from Seeking Alpha). The author has no business relationship with any company whose stock is mentioned in this article. Additional disclosure: Information in this article represents the opinion of the analyst. All statements are represented as opinions, rather than facts, and should not be construed as advice to buy or sell a security. Ratings of “outperform” and “underperform” reflect the analyst’s estimation of a divergence between the market value for a security and the price that would be appropriate given the potential for risks and returns relative to other securities. The analyst does not know your particular objectives for returns or constraints upon investing. All investors are encouraged to do their own research before making any investment decision. Information is regularly obtained from Yahoo Finance, Google Finance, and SEC Database. If Yahoo, Google, or the SEC database contained faulty or old information it could be incorporated into my analysis.

Avoiding The Pitfalls Of Factor-Based Investing

By DailyAlts Staff The proliferation of smart beta ETFs may be a relatively recent phenomenon, but the risk factors used to construct smart-beta indexes – most notably value, momentum, low beta, quality, illiquidity, and size – have been a popular topic for financial researchers for nearly three decades. Building off the early handful of factors, factor-based investing has since been expanded to as many as 250 distinct factors that have allegedly generated historical outperformance, but Research Affiliates’ Jason Hsu, Vitali Kalesnik, and Vivek Viswanathan argue that the supposed outperformance of most (if not all) of these new factors is illusory, based on cherry-picking by researchers and “artifacts” of the data. In fact, Mr. Hsu and his colleagues believe at least one of the traditional factors may be unlikely to generate superior risk-adjusted returns going forward. The researchers make their case in the Summer 2015 edition of The Journal of Index Investing , in an article titled “A Framework for Assessing Factors and Implementing Smart Beta Strategies.” Factor Robustness Hsu, et al. allege that economists, financial researchers, and other quantitative analysts are constantly trying to determine new factors, and that only their positive results are likely to get published. New research undermining an existing and semi-popular factor is unlikely to make it to the stage of peer review, according to Research Affiliates. This means that investors, advisors, and other decision-makers must test would-be factors for robustness themselves. Behind the quantitative data, Hsu, et al. insist that factors must be based on economic intuition and make sense within a theoretical framework – otherwise, they’re likely to be statistical noise. Factor premiums can be based on risk or behavioral issues, but in either case, they should span across geographic markets. If back-testing reveals a factor premium for U.S. stocks, that same premium should be evident in Japan and elsewhere. But when analyzed across geographic regions, only the value and low-beta factors consistently hold up; while momentum, quality, and illiquidity are mixed; and size shows no consistency whatsoever. (click to enlarge) Factor Perturbations Since legitimate factors must make intuitive sense, it stands to reason that they should hold up under “perturbations” of their definitions. For example, the value factor is typically defined with book-to-price ratio, but dividend yield and earnings yield (earnings-to-price) also make sense. Therefore, if the value premium were only evident when measured according to book-to-price, the theoretical framework would crumble. Fortunately for value investors, Research Affiliates’ research indicates that value holds up well under a variety of definitions – as do the momentum, low-beta, and illiquidity factors – but quality and size do not. (click to enlarge) Size Doesn’t Matter? According to Hsu, et al., the small-size factor premium is based on back-testing that includes several months of major small-cap outperformance back in the 1930s, and the factor has not generated alpha since its discovery in the early 1980s. Of course, the 1930s were a time of deflation (strengthening dollar) and the 1980s kicked off a 30-year bull market in bonds (weakening the dollar), which could play a significant role in the data. Today, it is generally assumed that small-cap stocks – with a higher degree of U.S. dollar exposure – benefit from a strong currency. Implementation and Allocation Hsu, et al.’s paper looks into implementation and allocation issues, as well, and notes that transaction costs are rarely taken into account by factor-based investors – and this is a mistake. To maximize risk-adjusted returns, factor-based investors should rotate their portfolios only as often as is necessary to capture the factor premium, and no more. The authors say that factor allocation faces many of the same challenges as asset allocation, and that smart-beta solutions should be customized to meet individual investors’ unique risk tolerances. For more information, visit researchaffiliates.com to download a pdf copy of the paper .

Utility CEFs For Defensive Income

Summary Utilities have gone from overvalued to a more reasonable valuation. At appropriate valuation, the utility sector offers opportunity for defensive income investing. This article summarizes nine utility closed-end funds with a median distribution yield of 7.6%. Only a few months ago the utility sector was overvalued. Such is the nature of a bond-substitute investment when bond yields collapse and investors look for safe income elsewhere. But the sector has given back 15% since last January’s high and overvaluation is much less the case. (click to enlarge) Figure 1: Dow Jones Utility Average ( google finance ). Although still about 7% above the 52 week low, the sector has been trading below its 20, 50 and 100 day simple moving averages, and appears to have found support recently (see chart in Fig. 1). An income investor wary about the prospects of a looming correction may well be considering this background as a reason to focus attention on this most defensive of sectors. When I’m looking for income investments, my first stop is to look to closed-end funds. For one thing, CEFs can provide excellent income relative to ETFs or holding individual stocks. For another, CEFs tend to overreach sector movements, so when a sector like utilities approaches bargain territory, sector CEFs may exaggerate the apparent value. Utility Closed End Funds Cefconnect.com lists nine utility funds. These are summarized below: Fund Market Cap % USA Blackrock Utility & Infrastructure Trust (NYSE: BUI ) $314,921,520 72.7% Duff & Phelps Global Utility Income Fund Inc. (NYSE: DPG ) $694,255,355 57.0% Wells Fargo Advantage Utilities & High Income Fund (NYSEMKT: ERH ) $108,982,680 46.4% Gabelli Global Utility & Income Trust (NYSEMKT: GLU ) $77,567,946 61.5% Gabelli Utility Trust (NYSE: GUT ) $298,074,054 100.0% Macquarie/First Trust Global Infrastr/Util Div & Inc Fund (NYSE: MFD ) $137,707,333 41.8% Macquarie Global Infrastructure Total Return Fund Inc. (NYSE: MGU ) $306,986,780 36.6% Cohen & Steers Infrastructure Fund Inc (NYSE: UTF ) $1,877,774,640 58.0% Reaves Utility Income Fund (NYSEMKT: UTG ) $844,916,800 100.0% Two of the nine are purely domestic; the others are global in scope. All but one of the funds currently sells at a discount to NAV. GUT maintains a premium of 28.4%. This leaves the Reaves Utility Fund as the only wholly domestic utility CEF to be priced at a discount (-4.15%). Figure 2. Premium/Discount status of Utility CEFs ( cefanalyzer.com ) Distributions Distributions range from a low of 6.1% to a high of 8.7%. Median distribution for the nine funds is 7.6%. Figure 3. Utility CEF distributions on price and NAV (cefanalyzer.com). Typical of closed-end funds, these distributions exceed that of utility ETFs such as, for example, the Guggenheim S&P 500 Equal Weight Utilities ETF (NYSEARCA: RYU ) with a current yield of 5.3% or the iShares Global Utilities ETF (NYSEARCA: JXI ) currently yielding 3.14%. The enhanced yields are achieved by the usual equity closed-end fund strategies of leverage (for 8 of the funds) and option-writing for the remaining fund. In addition, some of the funds generate income from utility debt instruments including bonds and preferred shares. (click to enlarge) Figure 4. Percent leverage for utility CEF portfolios (cefanalyzer.com). Total Returns The following charts show total returns on NAV and Market Price for 1, 3 and 12 months. Figure 5. Total return for utility CEFs on NAV (top) and Market Price (bottom) basis (cefanalyzer.com). None has turned in a gain on NAV for the past month, as one would expect from the utility sell-off noted in Figure 1 above. GUT has managed a positive price return over that time as its premium has increased from an already high 25% to 28%. During this time most of the remaining funds have seen their discounts deepen. Z-Scores Looking carefully at these return performance charts it becomes clear that for several of the funds, price returns are not tracking NAV returns. BUI, for example has suffered declines in market price while turning in respectable gains on NAV relative to its peers. This situation can be demonstrated most effectively by looking at Z-scores, which quantify the relationship between current premium/discount and mean premium/discount status. Figure 6. Z-Scores for 3, 6, and 12 months for utility CEFs (cefanalyzer.com). The Z-scores for GUT illustrate the extent to which its premium has been increasing relative to its average status for this metric. The current premium is more than 2 standard deviations greater than the average premium for each of the time periods shown. Contrast that with BUI whose discounts for 3 and 12 months are approximately 3 standard deviations below their means with Z-scores of -3.1 for both 3 and 12 months and -2.4 for 6 months. UTF, DPG and ERH also have low negative Z-scores. If one believes that reversion to mean discount/premium status is a likely predication, then these three funds would seem attractively priced on this basis. Summary and Selections Investors seeking high-income yield with defensive characteristics may want to look carefully at the utility sector. I think it’s a fair generalization that defensive investing is not something one normally associates with leverage, so the inclination would be to look to funds with no or minimal leverage. For the nine closed-end funds that comprise the sector’s offerings, only one is effectively unlevered (BUI, 0.9% leverage). The remaining funds carry 15% to 36% leverage. Investors who choose to focus on domestic utilities have only two choices: GUT and UTG. To my thinking there is no contest between the two; GUT’s unsustainable premium takes it out of my consideration. UTG sells at a discount of -4.1%, but this is somewhat higher than its 3 and 12 month mean discounts, and higher than all but one of the 8 discounted funds (MFG at -1.8%). UTG’s distribution yield (6.24%) is the second lowest of the group. The remaining funds carry discounts from -12 to -14%. One of these stands out for having an exceptionally deep discount relative to its historical status. BUI’s yield is an attractive 7.8%, a bit above the median yield of 7.6% for all the funds. These factors, along with its unleveraged status, makes it my choice from this group of funds. In closing I’d like to present a snapshot of the portfolios of my two picks here. Both are nearly entirely equity. UTG includes 4% MLPs and less than 1% preferred stock and corporate bonds. Both are more diverse than strict utility-sector portfolios. BUI holds 53% Utilities, 25.7% Energy and 12.5% Transportation. UTG breaks its portfolio down by industry rather than sector, with the top three being Multi-Utilities, 27.8%; Oil, Gas & Consumable Fuels, 18.5%; and Transportation Infrastructure, 16.03%. Top ten holdings for each are: UTG   NextEra Energy Inc (NYSE: NEE ) 5.25% DTE Energy Holding Company (NYSE: DTE ) 4.87% ITC Holdings Corp (NYSE: ITC ) 4.72% Union Pacific Corp (NYSE: UNP ) 4.66% Verizon Communications Inc (NYSE: VZ ) 4.25% American Water Works Co Inc (NYSE: AWK ) 3.94% Duke Energy Corporation (NYSE: DUK ) 3.65% SCANA Corp (NYSE: SCG ) 3.64% Dominion Resources Inc (NYSE: D ) 3.57% BCE Inc (NYSE: BCE ) 3.45% Time Warner Cable Inc A (NYSE: TWC ) 3.10%         BUI   NextEra Energy Inc 4.35% CMS Energy Corp (NYSE: CMS ) 3.86% Sempra Energy (NYSE: SRE ) 3.81% Dominion Resources Inc 3.77% Dominion Midstream Partners LP (NYSE: DM ) 3.62% Shell Midstream Partners LP (NYSE: RDS.A ) 3.52% Duke Energy Corporation 3.37% National Grid Plc (NYSE: NGG ) 3.31% Atlantia SPA ( OTCPK:ATASY ) 2.96% American Water Works Co Inc 2.78% Disclosure: The author has no positions in any stocks mentioned, but may initiate a long position in BUI over the next 72 hours. (More…) The author wrote this article themselves, and it expresses their own opinions. The author is not receiving compensation for it (other than from Seeking Alpha). The author has no business relationship with any company whose stock is mentioned in this article.