Tag Archives: function

The Case For Considering The Australian Equity Market

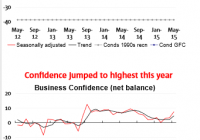
Summary Australia had record high business confidence on low AUD and consumption boost. Labor market continued to grow in a sustained manner along with the housing and credit markets. This might be the time to buy into Australian equities as both internal and external conditions merged to form bullish condition. Australia might be iconic to the average Americans as the land of the kangaroos but it has more to offer than tourism. The Australian economy is on the steady path of recovery as seen in the record high of business confidence, recovering labor market and better credit condition. This represents a great opportunity to gain exposure to the Australian market for this recovery had been ongoing since the beginning of this year. Australia had been blessed with its proximity to the emerging Asia, strong reserves of minerals and other raw materials and a dovish central bank that cut rate twice this year as a precaution. As a result, the recovery in Australia took hold and through months of consistent performance, it is now deeply rooted as the latest May data would show. However the Australian stock market remains discounted as market confidence was shaken by the weaker than expected US and Chinese economic data. This is now changing as the US and Chinese economies are on the mend as seen in recent articles. Record High Business Confidence We shall first delve into the May survey of business sentiment as conducted by the National Australia Bank (NAB). Business confidence went up from +3 in April sharply to +7 in May as all business sector (except mining) had a better outlook on business conditions. This +7 reading of business confidence is the record high this year. Source: NAB Business conditions were lifted by the twin effects of the lower AUD and supportive budget released this year. The recent low 2% interest rates by the Reserve Bank of Australia (NYSE: RBA ) also helped in the credit conditions for the housing market and business lending. Consumption and consumer confidence have also staged a steady recovery. These conditions had led non mining businesses as a whole to revisit their reluctance towards capital expenditure and to invest for the future. The manufacturing industry led the recovery on the tailwinds of the lower AUD while the mining industry continued to contract on reduced Chinese demand. Forward looking indicators such as new orders are also pointing towards the right direction for future growth. The overall trend is clear towards greater business confidence for Australia. Strengthening Australian Labor Market The next piece of good news for the Australian economy is the improving labor market as reported by the Australian Bureau of Statistics ( ABS ) for May 2015. The major good news is that the Australian economy had added 42,000 new jobs in May and this is resulted in the lowering of the unemployment rate from 6.1% to 6.0%. (click to enlarge) The reduction of the mining sector had resulted in the net increase in Australian unemployment rate as seen in the chart above. However this had been largely reversed since January 2015. The improving economy had been able to absorb the increasing workers made redundant as mining companies cut back on production. This improvement is all the more remarkable because this reduction is done without any corresponding reduction in the overall employment rate as seen in the table below. In other words, the unemployment rate came down not because of more discouraged workers as was the case in the US 5 years back in 2010. The unemployment came down because the labor pool expanded and more people are now working. (click to enlarge) Source: ABS In fact, the labor participation rate crept up by 0.2% over a 1 year period as the labor pool expanded to 11.75 million and 64.7% of Australians are gainfully employed. This means that Australian have greater income as a whole and would naturally consume more in the future. Housing And Credit Market Lastly we can look at the status of the Australian housing market. Bubbles are formed when housing are purchased for the purpose of speculation instead of dwelling. This, along with lax credit conditions, is the root cause of the US housing bubble, which burst in 2007. The Australian regulators are mindful of this painful episode and they had recently cracked down on runaway housing prices especially on foreign purchase of property for ‘investment’ purposes. This has resulted in the majority of purchase being used for residential purposes. In May, out of $32 billion worth of housing commitments, $19 billion is for owner occupation while $13 billion is for the purpose of investment. In other words, a good 59% of new housing being built in Australia will be occupied by owners and they are not likely to bid prices up to excessive levels in hopes of flipping it for profit as soon as regulation permits. (click to enlarge) Source: ABS The strength of the Australian housing market can also be seen in the upwards momentum of both the value and number of housing commitment. This is supported by modest and sustained increase in loans as seen in the chart below. (click to enlarge) The chart shows that the credit market in Australia had been rising for 3 consecutive months in a row. Conclusion If we were to put the recent domestic conditions of better business confidence, labor condition, housing and credit market in May together with the recovering economic conditions in the 2 largest economy in the world, this would signal the path towards a sustained economic recovery for Australia is now under way. This would mean this current price of $22 might the low price for the iShares MSCI Australia ETF (NYSEARCA: EWA ) which is the broad based representation of the best of Australian equity. The conditions are ripe for the bottoming out of Australian equities as both internal and external conditions coincide for a strong and sustained economic recovery. Disclosure: The author has no positions in any stocks mentioned, and no plans to initiate any positions within the next 72 hours. (More…) The author wrote this article themselves, and it expresses their own opinions. The author is not receiving compensation for it (other than from Seeking Alpha). The author has no business relationship with any company whose stock is mentioned in this article.

Is It The Right Time For Homebuilder ETFs?

An improving economy and an impressive recovery in the housing market boosted the U.S. homebuilder sentiment in June to a nine-month high. The National Association of Home Builders (NAHB)/Wells Fargo housing market index rose five points from May to 59 in June, in line with the September 2014 reading. The September’s reading was the highest since Nov 2005. The sentiment also exceeded the market expectation of 56 points. Meanwhile, the report also showed that the index that measures sales expectations for the next six months jumped six points to 69 in June. Also, the index measuring buyer traffic increased five points to 44. Moreover, the report revealed that the three-month moving average indexes in the South, Northeast and West witnessed a healthy increase in June. Though the index declined in the Midwest to 54, the reading above 50 indicated that builders were still optimistic for the region. All of these data show that the housing market is set for a strong performance this year overcoming the negative impact of a harsh winter in the first quarter. The Chief Economist at NAHB David Crowe said that readings “are at their highest levels since the last quarter of 2005, indicating a growing optimism among builders that housing will continue to strengthen in the months ahead.” Impressive Housing Recovery Most of the major housing data that released in May were encouraging. While new home sales surged 6.8% in April, construction spending soared to a more than six-year high. Also, Pending Home Sales Index, which measures housing contract activity, gained 3.4% from the previous month to 112.4 in April, hitting its highest level since May 2006. Existing home sales were the only major housing data that failed to increase in April. However, it is speculated that existing home sales in 2015 may reach the highest level since 2006. Separately, a rise in home prices also signaled toward an increase in demand in the housing market. The S&P/Case-Shiller’s 20-City composite index, the leading measure of U.S. home prices, rose 5% year on year in March. Similarly, the 10-City composite index increased 4.7% year on year in March. Economic Improvement After the first-quarter slowdown, several indicators signaled that the economy is gradually gaining strength. According to the U.S. Labor Department, the U.S. economy created a total of 280,000 jobs in May, witnessing the largest job addition since December 2014. Though the unemployment rate marginally rose to 5.5% in May, the rate is expected to decline gradually to Fed’s target this year. Average hourly wages also saw an impressive year-on-year gain of 2.3%, indicating a strong recovery in labor market conditions. Moreover, factors including improving consumer confidence, low oil prices and the prevailing low rate environment have boosted the housing market in recent times. Despite the prospect of a rate hike this year, the outlook for the housing market remains positive for the year. Rising Rate Concerns The mortgage-finance company Freddie Mac reported that the average rate for a 30-year fixed mortgage climbed to an eight-month high of 4.04% for the week ending June 11 from 3.87% from the previous week. This represents the sharpest increase since 2013. However, increase in mortgage rates seems to have a negligible impact on housing as demand remained strong following the concern that rates will continue to move higher. Meanwhile, strong economic data indicates that the economy is back on track in the second quarter, leaving behind the first quarter contraction. This raised the possibility of a rise in interest rates, which have been near zero since the 2008 financial crisis. Analysts are expecting a possible rate hike in September or October this year, which may have a negative impact on the housing market. ETFs in Focus Homebuilder ETFs may see a boost in the near future on the back of a favorable economic environment. However, investors will closely watch the prospect of a rate hike this year and its impact on the housing market. In this scenario, we highlight two homebuilders ETFs that will remain on investors’ radar in the coming days. SPDR S&P Homebuilders ETF (NYSEARCA: XHB ) This fund provides exposure to 37 firms by tracking the S&P Homebuilders Select Industry Index. The fund is also quite popular with $1.7 billion in its asset base while it sees a solid volume of more than 4 million shares a day. None of the firms accounts for more than 3.72% of the total assets. Sector-wise, Homebuilding takes the top spot at about 33% share while Building Products, Homefurnishing Retail and Homefurnishings also have double-digit allocation. XHB charges a fee of 35 bps annually and has a Zacks Rank #3 (Hold) with a High risk outlook. The fund has returned 2.3% over the past three-month period and rose 6.7% this year. PowerShares Dynamic Building and Construction (NYSEARCA: PKB ) This product tracks the Dynamic Building & Construction Intellidex Index, holding 30 securities in its basket. The fund charges 63 bps in fees. Nearly 46% of the fund’s assets are allocated to the top 10 holdings. PKB has amassed $54.5 million in its asset base while it has an average daily volume of around 15,000 shares. The product has a Zacks Rank #3 with a High risk outlook. The ETF has returned 4.2% over the past three-month period and gained 11% in the year-to-date frame. Original Post

Northland Power – A Renewable Energy Giant In The Making

Summary Northland is an independent power producer with a total capacity of 1,356 MW. The company has two giant offshore wind farm projects under construction. These projects should turn the company into one of the world’s biggest renewable energy producers. Currently, Northland shares are undervalued. Northland Power (OTCPK: NPIFF ) is a Canada based independent power producer. As of March 31, 2015, the company owns or has a net economic interest in power producing facilities with a total capacity of approximately 1,356 MW. Northland’s facilities produce electricity from natural gas and renewable resources. Apart from that, the company is developing a few renewable energy projects, which, in a few years, should transform Northland into one of the biggest green companies in the world. In this article I am trying to provide a short description of these projects; in the final section I will try to assess the value of the company’s shares. Capacity As of the end of 2014, the company’s facilities had a total capacity of 1,356 MW, of which the biggest share belonged to thermal facilities (62% of total capacity). The chart below shows the capacity breakdown: source: Simple Digressions and the company’s reports In a few years this situation is going to change. The company has four renewable energy projects under construction (discussed below), which should commence their operations in the next three years. Therefore at the end of 2017, when these projects are finished, the overall company’s capacity should stand at 2,428 MW with renewable energy facilities generating as much as 58.1% of the electricity (chart below). source: Simple Digressions and the company’s reports Northland is turning from thermal generation to renewable energy Looking at the company’s electricity sales it is easily spotted that Northland perceives renewable energy as its main growth driver. Since 2009 the electricity sales generated by thermal facilities have been rising at the rate of 24.7% a year. But in the same time span the electricity sales generated by renewable energy facilities have been rising at much higher rate of 65.8% a year. This trend is going to strengthen in the next three years because all projects under construction are renewable energy ones (wind and solar). Let me discuss these projects in detail. Gemini Gemini is an offshore wind development project located 85 km off the North East coast of the Netherlands. The project will consist of 150 Siemens wind turbine generators, each with a capacity of 4 MW (600 MW in total). Gemini is one the biggest offshore wind projects in the world – the total capital expenditures are expected to be €2.8 billion. Despite these large expenditures, Gemini is an example of a successful non-recourse project financing where expenditures of €2.2 billion will be financed by debt (senior debt of €2.0 billion and subordinated debt of €0.2 billion). The Northland stake in Gemini accounts for 60% – it means that the company’s portion of the equity and junior debt is estimated to be €288 million. The project was awarded up to €4.4 billion of public funding to supplement market revenues from electricity sales. This 15-year award is called SDE Grant and has been issued by the government of the Netherlands. Simply put, the SDE Grant is a contract-for-differences, which supplements market electricity prices traded on the Amsterdam Power Exchange. In order for Gemini to earn the market based component of revenue, a power off-take balancing agreement has been signed with Delta Energy BV, a subsidiary of a Dutch utility company. Currently the financing is closed and Gemini entered its construction phase. The project is expected to be finished in 2017. Northland estimates that Gemini will be producing 2,600 giga-watt hours per year. The company also estimates that the annual EBITDA generated by the project should stand at C$560 – 570 million. Nordsee One Nordsee One, similarly to Gemini, is another offshore wind development project. It is located 40 km north of Juist Island in the North Sea. The project will consist of 54 Senvion wind turbines generators, each with capacity of 6.15 MW (332.1 MW in total). The Nordsee One capital costs are estimated to be €1.2 billion – similarly to Gemini, these expenditures will be financed by non-recourse debt and equity. According to the company’s announcement on the financing close: “Approximately 70% of the project’s required costs will be provided from an EUR840 million non-recourse secured construction and term loan and related loan facilities from ten international commercial lenders. Reflecting the strength of Nordsee One, the financing was oversubscribed. The lending group includes ABN AMRO, Bank of Montreal, Commerzbank, Export Development Canada, Helaba, KfW IPEX, National Bank of Canada, Natixis, Rabobank and The Bank of Tokyo-Mitsubishi” The Northland’s stake in the project accounts for 85%, which means that the company’s portion of equity is estimated to be €288 million. As in the case of Gemini, Nordsee One qualifies for a revenue subsidy. This time it will be a subsidy from the German government granted for 9.6 years (called EEG). It is once again a contract-for-differences, which guarantees a fixed electricity sale price over the subsidy duration. Northland estimates the Nordsee One average annual energy production at 1,200 giga-watt hours; the annual EBITDA generated by the project should stand at C$300 – 310 million. The project is expected to be finished in 2017. Grand Bend Wind Project It is a jointly held (with a 50% stake belonging to the Aamjiwnaang and Bkejwanong First Nations) wind project with a capacity of 100 MW located in Grand Bent, Ontario, Canada. Northland is a developer, construction manager, co-owner and operations manager. The project has a 20-year power purchase agreement with Ontario Power Authority. Project financing is completed and all construction contracts have been signed. The company expects the project to commence operations in spring 2016. The project budget is estimated at C$384 million. Ground-mounted Solar Projects The project consists of 4 individual ground-mounted solar projects with a total capacity of 40 MW. This is a third phase of a partly finished operation, which should be completed in 2015. Northland estimates the project costs to stand at C$329 million, which is around C$83 million higher than previously estimated (this increase is due to legal claims against the former project contractor). The annual EBITDA generated by the project should stand at C$ 22 million. Financial results Since its 2011 conversion from an income trust to a corporation, Northland has been steadily improving its financial results. The company has been increasing its revenue and operating income. On the other hand, due to a very ambitious investment plan realized by Northland, the company’s bottom line looks worse. Finance costs and unrealized losses on derivative contracts are the main contributing factors. For example, in 2014 Northland reported finance costs (interest on debt, borrowings and bank fees) of C$119.9 million. Additionally, Northland reported a loss of C$296.6 million on foreign exchange hedges (these losses were non-cash issues). Therefore, in 2014 the company showed a net loss of C$177.7 million. Now, let me discuss an issue, which is one of the most important metrics in evaluation of any dividend-paying energy company, namely its free cash flow. The chart below evidences free cash flows and dividends paid by the company: (click to enlarge) source: Simple Digressions and the company’s reports As the chart shows, since 2010 Northland has been increasing its dividends. Unfortunately, in the period 2010 – 2012 these increases were not backed by higher free cash flows – the company was over paying its dividends, which was evidenced by the so-called payout ratio, which was higher than 100% (if a payout ratio is higher than 100% a company is paying higher dividend than its free cash flow allows – in the long term such a situation is unsustainable). But since 2013 the company’s dividends have been backed by its free cash flow, with payout ratios of 70 % and 76% in 2014 and 2013 respectively. In the coming years the company expects that its payout ratio will rise over 100% once again. Till 2017 Northland will be involved in construction of two large wind projects (Gemini and Nordsee One). This process demands a lot of money therefore the company, which is determined to sustain its dividends, will have to increase its payout ratio above 100% once again (free cash flow, due to higher investment, will decrease). When both projects are in operation (in 2017) the payout ratio should go well below 100% (due to the increased free cash flow from Gemini and Nordsee One) – please, look at the slide below: (click to enlarge) source: the company’s presentation (page 84) Valuation To estimate value of Northland shares I am using the ratio of EV / EBITDA (enterprise value / earnings before interest, taxes, depreciation and amortization). Because it is quite difficult to find current and reliable EV / EBITDA ratios reported in the renewable energy sector, I am calculating the Northland value using two available ratios: multiple of 9.2 assumed by the Ernst&Young report for base-load independent power producers in the Americas multiple of 14.32 assumed by Aswath Damodaran for Green and Renewable Energy sector In my opinion, the multiple published by professor Damodaran seems to be more appropriate for Northland because this company is currently in a transitory period, which should bring it from a base-load energy producer to a renewable energy company. Another assumption – my calculations are divided into two blocks: Value calculated for current operations Value calculated for two the most important wind projects: Gemini and Nordsee One. Total value is calculated through adding up value of current operations and value of Gemini and Nordsee One. The tables below show the way I have calculated value of Northland: source: Simple Digressions and the company’s reports As the last table shows, I estimate that one share of Northland is worth between $19.9 and $44.6 . Currently the Northland’s shares are trading around C$16 per share, which means undervaluation. Editor’s Note: This article discusses one or more securities that do not trade on a major U.S. exchange. Please be aware of the risks associated with these stocks.