Allocating Assets When The Fed Talks Out Of Both Sides Of Its Mouth
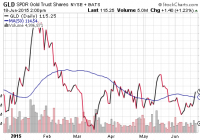
One year ago, each of the 17 members of the Federal Reserve provided an expectation of where the fed funds rate would be at the end of 2015. The average came in at 1.1%. Here in mid-June, the average expectation for committee members for the end of the year now registers 0.45%. If the party is set to rage on, then, shouldn’t investors aggressively allocate dollars in U.S. equities? Not from my vantage point. One year ago, each of the 17 members of the Federal Reserve provided an expectation of where the fed funds rate would be at the end of 2015. The average came in at 1.1%. That might have required four to five rate hikes this year alone. By March, the expected year-end rate dropped to 0.65%. Perhaps two or three rate increases, then? Nope. Here in mid-June, the average expectation for committee members for the end of the year now registers 0.45%. The financial markets have even less conviction about a 2015 increase to the cost of borrowing. Investors via fed funds futures are only pricing in a 22% chance that the Federal Reserve raises the benchmark rate in September and a 62% probability of a rate liftoff at the central bank’s December meeting. Personally, I imagine one face-saving hike this year – a one-n-done to say that they did it. Nevertheless, nobody will be removing much of the alcoholic punch from the the party’s punch bowl anytime soon. Diminished expectations have not been confined to 2015 alone. Fed forecasts for year-end 2016 have dropped from roughly 1.9% to 1.6%. For 2017, they’ve moved down to 2.9% from 3.1%. And that’s not all that the Fed has downgraded. As recently as three months earlier, the institution anticipated 2015 economic growth at 2.3%-2.7%. Yesterday, committee members revealed an assessment of a lethargic 1.8% to 2.0%. Wait a second. Haven’t chairwoman Yellen and her colleagues been prattling on about economic acceleration since last year? Haven’t they been stressing transitory factors to explain every bit of weakness, while simultaneously pointing to improvements wherever they can be emphasized? With one side of its collective mouth, committee members are talking up the economy’s advances. With the other side, it currently believes that the economy will grow even slower than its post-recession growth rate of approximately 2.1%. Keep in mind, our 2.1% post-recession performance is historically weak under normal circumstances. Since 6/2009, though, America received $7.5 trillion in stimulus by the U.S. government; we received $3.75 trillion in electronic dollar equivalents by the Federal Reserve. In other words, unprecedented fireworks only enabled the economy to grow at a lethargic pace. Meanwhile, based on what the Fed members report outside of the media spotlight, they anticipate additional cooling off here in 2015 (circa 1.8%-2.0%). Is it any surprise that stocks would rocket on the probability of fewer anticipated rate hikes alongside a less vibrant economy ? Heck, the Fed successfully talked down the U.S. dollar, kept bond yields from extending their recent tantrum and sent the SPDR Gold Trust ETF (NYSEARCA: GLD ) back above 50-day moving average. If the party is set to rage on, then, shouldn’t investors aggressively allocate dollars in U.S. equities? Not from my vantage point. Successful investors tend to sell complacency, rather than purchase more of it. And “risk-on” investors have become incredibly complacent with respect to sky high valuations as well as Fed accommodation. Understand the real reason that the Fed is even talking about raising short-term rates at all. The monetary policy authorities need to bolster the Fed’s arsenal before the next recession, external shock and/or “black swan” event. They are no longer capable of moving from a 5% fed funds rate range down to 1% or 0%. Instead, we’re now talking about maybe – possibly, someday – getting up to 3% before going back to 0% rate policy and a 4th iteration of quantitative easing (“QE4”). In truth, I doubt that the Fed will ever be able to move beyond 1% before reversing course. Japan has spent the last 15 years stuck at 0.5% or less. That has everything to do with our reliance on zero percent rates and asset purchases with currency credits (“QE”) for six years. Japan made the same error in judgment. Admittedly, the Fed has been marvelously successful at persuading businesses to buy back their stock shares; they’ve convinced pensions, money managers, mutual funds and real estate investors to stay engaged, enhancing the “wealth effect” for the wealthiest among us. (Yes, that includes me.) On the other hand, I have seen the same excesses throughout the decades. I witnessed firsthand what happened to Taiwanese equities in 1986 when Taiwan R.O.C. opened its doors to outside investors. The irrationally exuberant run-up met its panicky demise the following year. I warned investors to have an exit approach to the insanity of dot-com euphoria in the late 1990s; I offered the same warnings leading up to the 2007-2009 financial collapse. In essence, you do not have to be sitting 100% in cash. We still remain invested in core positions such as the Vanguard Mid-Cap Value ETF (NYSEARCA: VOE ), the iShares S&P 100 ETF (NYSEARCA: OEF ) and the Vanguard High Dividend Yield ETF (NYSEARCA: VYM ). Yet we have also raised 10%-25% cash in our portfolios (depending on client risk tolerance) as stop-limit loss orders have hit on both bond and stock positions. We let go of energy investments that did not pan out. We stopped out of longer-term bonds earlier this year. And Germany via the iShares Currency Hedged MSCI Germany ETF (NYSEARCA: HEWG ) is no longer in the mix of any client. The result? More cash for future buying opportunities. And that buying opportunity is likely to be far more consequential than a 3% pullback. With only a few exceptions, we believe it is far more sensible to wait for the real deal – a 10%-plus correction and/or a 20%-plus bear. Disclosure: Gary Gordon, MS, CFP is the president of Pacific Park Financial, Inc., a Registered Investment Adviser with the SEC. Gary Gordon, Pacific Park Financial, Inc, and/or its clients may hold positions in the ETFs, mutual funds, and/or any investment asset mentioned above. The commentary does not constitute individualized investment advice. The opinions offered herein are not personalized recommendations to buy, sell or hold securities. At times, issuers of exchange-traded products compensate Pacific Park Financial, Inc. or its subsidiaries for advertising at the ETF Expert web site. ETF Expert content is created independently of any advertising relationships.