Tag Archives: function

How To Avoid The Worst Style ETFs: Q2’15 In Review

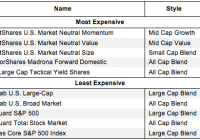
Summary The large number of ETFs has little to do with serving your best interests. Below are three red flags you can use to avoid the worst ETFs. The following presents the least and most expensive style ETFs as well as the worst overall style ETFs per our 2Q15 sector ratings. Question: Why are there so many ETFs? Answer: ETF providers tend to make lots of money on each ETF so they create more products to sell. The large number of ETFs has little to do with serving your best interests. Below are three red flags you can use to avoid the worst ETFs: 1. Inadequate Liquidity This issue is the easiest to avoid, and our advice is simple. Avoid all ETFs with less than $100 million in assets. Low levels of liquidity can lead to a discrepancy between the price of the ETF and the underlying value of the securities it holds. Plus, low asset levels tend to mean lower volume in the ETF and larger bid-ask spreads. 2. High Fees ETFs should be cheap, but not all of them are. The first step here is to know what is cheap and expensive. To ensure you are paying at or below average fees, invest only in ETFs with total annual costs below 0.49%, which is the average total annual cost of the 289 U.S. equity Style ETFs we cover. Figure 1 shows the most and least expensive Style ETFs. QuantShares provides three of the most expensive ETFs while Schwab ETFs are among the cheapest. Figure 1: 5 Least and Most-Expensive Style ETFs Sources: New Constructs, LLC and company filings Investors need not pay high fees for quality holdings. Arrow QVM Equity Factor (NYSEARCA: QVM ) earns our Very Attractive rating and has low total annual costs of only 0.72%. On the other hand, no matter how cheap an ETF, if it holds bad stocks, its performance will be bad. The quality of an ETFs holdings matters more than its price. 3. Poor Holdings Avoiding poor holdings is by far the hardest part of avoiding bad ETFs, but it is also the most important because an ETF’s performance is determined more by its holdings than its costs. Figure 2 shows the ETFs within each style with the worst holdings or portfolio management ratings . Figure 2: Style ETFs with the Worst Holding Sources: New Constructs, LLC and company filings State Street, iShares, and PowerShares appear more often than any other providers in Figure 2, which means that they offer the most ETFs with the worst holdings. Our overall ratings on ETFs are based primarily on our stock ratings of their holdings. The Danger Within Buying an ETF without analyzing its holdings is like buying a stock without analyzing its business and finances. Put another way, research on ETF holdings is necessary due diligence because an ETF’s performance is only as good as its holdings’ performance. PERFORMANCE OF ETF’s HOLDINGS = PERFORMANCE OF ETF Disclosure: David Trainer and Max Lee receive no compensation to write about any specific stock, style, or theme. Disclosure: I/we have no positions in any stocks mentioned, and no plans to initiate any positions within the next 72 hours. (More…) I wrote this article myself, and it expresses my own opinions. I am not receiving compensation for it. I have no business relationship with any company whose stock is mentioned in this article.

Volatility Decays Without The Roll

“Roll Yield” is a frequently spoken about but lesser understood phenomenom. Volatility futures decay without the roll. Continue to short volatility for excellent long-run gains. Roll decay is a term that is commonly thrown around when discussing futures. It is an easily observable phenomenon in commodities markets that results from a positively sloping forward curve. When an electronically-traded-product “rolls” contracts along such a curve, it sells near-term futures and uses the proceeds to buy further-out futures. In rolling, the net value of the fund has not changed. Maybe 12 near-term contracts valued at $10 each were sold for 10 further-out $12 contracts. The gross value is $120 immediately before the transaction and $120 immediately after the transaction. There is no decay in asset value. The decay happens afterwards…sometimes. In the example above, both contracts were priced above the spot rate, and the further-out contract was priced above the near-term. If the underlying asset is a random walk, then on average (long-term average), the moving average of the spot will be equal to the current spot. In other words, the expected return on carry is 0. So both futures will need to drift down, and the further-out future will need to drift down more. In the real world, most assets are not a random walk. They tend to drift themselves. If they are positively correlated with the market, they tend to drift upwards; and vice versa. In commodities and equities markets, this drift is fairly deterministic in the long-run and becomes implicit in the term structure. Therefore the “roll” decay is, in fact, a result of rolling less-overpriced contracts into more-overpriced contracts. The VIX is very different. It’s not a random walk. It’s a random spring. It makes a lot of noise but its long-run moving average is very predictable. When the VIX spot is $12 and the first month future is $14, the empirically derived mathematical expectation of the first future isn’t to converge to $12. Instead it is to converge to something like $13, as the spot springs from $12 back toward its center and hits $13 along the way. Likewise when the VIX spot is $30 and the first month future is $26, a long position on the first month future still decays (on average) because the spot drops down to something like $25 on average. Please see this article for elaboration: The take away is that the slope of the volatility forward curve is of little to no consequence. ETN’s like TVIX, VXX, and VXZ will continue to decay so long as they are tied to VIX futures that are themselves individually overpriced (in comparison to their mathematical/statistical expectations.) For something like the VXX, the “roll” decay occurs because it is in constant possession of two futures contracts (M1 and M2), that are in an almost perpetual state of being over-priced. The allocations are irrelevant. If VXX stopped rolling contracts, any static mix of M1 and M2 would show similar performance on average. Volatility futures decay standing still. So unless you have a crystal ball or an uncanny ability to predict the future, betting against volatility futures continues to be highly advisable. There will be plenty of noise short-term, but long-term bets will reap in the green. And plea se see the following article if you would like to drown-out some of the noise: Disclosure: I/we have no positions in any stocks mentioned, and no plans to initiate any positions within the next 72 hours. (More…) I wrote this article myself, and it expresses my own opinions. I am not receiving compensation for it (other than from Seeking Alpha). I have no business relationship with any company whose stock is mentioned in this article. Additional disclosure: I am short volatility futures.

Adding ONEOK To My Dividend Pipeline

ONEOK (NYSE: ONE ) is a distributor of Natural Gas. Owning ONEOK allows me to get into the natural gas space without owning stock on the exploration side. I think of ONEOK as the FedEx (NYSE: FDX ) or UPS (NYSE: UPS ) of natural gas as it is the pipeline delivering product from point A to point B. I have wanted to get into natural gas pipeline stock, but honestly ONEOK has been overpriced until recently. Market downturns and an ongoing energy sector dip has created a good buying opportunity for this high dividend yielding stock. I purchased 40 shares of ONEOK, Inc. at $38.53 totaling $1,941.56. My Dividend Dreams Portfolio is getting heavy on energy stocks. To date, about 16% of my portfolio is in oil and gas. I prefer to only have 10% of my portfolio targeted in one area, so I will likely unload some oil stock on the next market gain. I own 100 shares of ConocoPhillips (NYSE: COP ), so this stock is the likely candidate for a reduction in shares. This purchase adds $96.80 to my annual dividend income . ONEOK Overview ONEOK, Inc. is the sole general partner of ONEOK Partners, L.P. (ONEOK Partners), a master limited partnership engaged in the gathering, processing, storage and transportation of natural gas in the United States. The company operates through three segments: Natural Gas Gathering and Processing, Natural Gas Liquids, and Natural Gas Pipelines. The Natural Gas Gathering and Processing segment provides nondiscretionary services to producers, including gathering and processing of natural gas produced from crude oil and natural gas wells. The Natural Gas Liquids segment owns and operates facilities that gather, fractionate, treat and distribute natural gas liquids (NGLs), and store NGL products, primarily in Oklahoma, Kansas, Texas, New Mexico and the Rocky Mountain region. The Natural Gas Pipelines segment owns and operates regulated natural gas transmission pipelines and natural gas storage facilities. Source: www.schwab.com. To learn more about ONEOK, Inc. visit the About Us section of the company website. ONEOK Dividends Annual Dividend Yield of 6.38% 5-Year Dividend Per Share Average of $1.37 5-Year Dividend Yield Average of 2.96% 3-Year Dividend Growth Rate of 25.3% 5-Year Dividend Growth Rate of 21% 10-Year Dividend Growth Rate of 17.1% Payout Ratio of 59.38% Dividend Coverage Ratio (NYSE: TTM ) of 168.42% The chart below shows the past eight years of annual dividends for ONEOK. This chart visually represents how impressive dividend raises have been for ONEOK. OKE has an impressive a 5-year dividend growth rate average of 21%. (click to enlarge) Source: www.schwab.com ONEOK Valuation S&P Capital IQ ranks OKE as a hold and 3-stars with a 12-month target price of $48. Morningstar ranks OKE as a buy, 4 stars with a fair value of $52. Using my dividend toolkit I used the dividend discount model analysis with the following metrics: 9% Discount Rate and an 5% Dividend Growth Rate. I get a fair value of $63.53. Conclusion I like owning distribution stocks because they own the pipeline for delivery. This is sort of a monopoly; if a seller wants to move goods, they need a distributor. There is safety in OKE because of this, however, this stock is still subject to natural gas pricing. I don’t see gas usage declining in the near future, so I am comfortable with my purchase. Also, natural gas prices are low, which means there is a lot of upside if prices recover. Full Disclosure: Long OKE