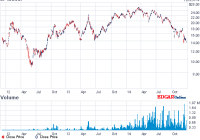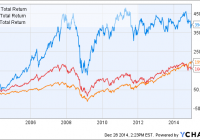
Summary Emerging markets have returned twice the U.S. markets over the last 11 years, but have struggled recently. Emerging markets are now very cheap, but investors may be put off by their higher volatility. Do low volatility emerging market funds deliver? Introduction Some years ago, emerging markets were all the rage. According to MSCI , emerging markets grew from 1% of the global market cap in 1988 to 11% in 2013. An investor who bought into iShares MSCI Emerging Markets ETF (NYSEARCA: EEM ) 11 years ago would have been rewarded with nearly a 400% gain, far ahead of S&P 500 (NYSEARCA: SPY ) (199%) and developed markets ex-U.S. (NYSEARCA: EFA ) (166%). EEM Total Return Price data by YCharts However, the above chart belies the fact that emerging markets have not performed well since the end of the financial crisis. Since 2009, EEM has returned only 72%, compared to 189% for SPY and 94% for EFA. EEM Total Return Price data by YCharts Given their relative underperformance over the past several years, is now the time to take a second look at emerging markets? Most analysts and fund managers are pessimistic on the prospects of emerging markets in 2015, which could actually be a contrarian signal. A recent Seeking Alpha article by Elite Wealth Management reported that in a November survey of fund managers with a combined $700 billion in assets, they were 0% overweight in emerging market equities, compared to 45% Japan, 25% U.S. and 8% Europe. Emerging markets are now very cheap. The table below shows the P/E ratios and dividend yields for the top 10 countries in EEM, compared to selected developing markets (source: Financial Times ). Also shown for the emerging market countries is the weight of that country in EEM. Country Weight % P/E Dividend yield % China 17.52 7.1 4.4 South Korea 13.64 15.6 1.2 Taiwan 12.20 13.9 3.0 Brazil 7.82 12.4 4.6 South Africa 7.75 16.4 3.1 India 6.69 18.2 1.6 Mexico 5.05 21.2 2.0 Russia 3.94 5.5 5.6 Malaysia 3.66 15.7 3.2 Indonesia 2.66 18.3 2.2 U.S. – 19.0 2.3 Japan – 16.5 1.7 U.K. – 15.9 3.3 Germany – 16.1 2.6 Canada – 17.9 2.8 We can see that the 9 out of the 10 emerging market economies have a P/E ratio lower than the U.S. (19.0). Only Mexico (21.2) has a higher P/E ratio than the U.S.; China and Russia have the lowest P/E ratios of 7.1 and 5.5, respectively. The following table shows the valuation ratios for ETFs of major world regions (data are from Morningstar and are forward-looking). Region ETF P/E P/B P/S P/CF Yield % U.S. SPY 18.03 2.48 1.78 7.77 2.08 Europe (NYSEARCA: VGK ) 16.19 1.74 1.04 6.96 3.21 Japan (NYSEARCA: EWJ ) 15.23 1.21 0.77 4.89 1.62 Asia ex-Japan (NASDAQ: AAXJ ) 12.68 1.39 1.17 6.05 2.43 Emerging Markets EEM 12.76 1.49 1.14 4.91 2.56 We can see from the data above that Asia ex-Japan and emerging markets have the lowest valuation metrics amongst the world regions. However, it might be argued that developed markets deserve a valuation premium over emerging markets due to their higher stability (see reasons below). Moreover, emerging markets have always had higher volatility compared to developed markets. This is likely due to a multitude of factors, such as less stable corporate and sovereign governance, less stable currency, smaller economies, reliance on foreign investment, and concentration in cyclical industries such as mining and energy. The below chart shows the volatility and beta values for EEM compared to SPY and EFA over the past 6 years. EEM 30-Day Rolling Volatility data by YCharts Low-volatility emerging market funds Would low-volatility emerging market (EM) funds be ideal for investors wanting some exposure to emerging markets, but with lower volatility? To my knowledge, there are three low-volatility EM funds on the market: EGShares Low Volatility EM Dividend ETF (NYSEARCA: HILO ), PowerShares S&P Emerging Markets Low Volatility Portfolio (NYSEARCA: EELV ) and iShares MSCI Emerging Markets Minimum Volatility (NYSEARCA: EEMV ). In a previous series of articles , we compared several high-dividend low-volatility U.S.-based funds. We found that those funds were able to achieve their dual objectives of high dividends and low volatility by overweighting mature and defensive industries such as utilities, healthcare and real estate. This article seeks to compare the three low-volatility EM funds. Note that this will be more of an overview of the three funds and rather than an in-depth analysis of a single fund. Fund details Details for the three low-volatility EM funds and EEM are shown in the table below (data from Morningstar). HILO EELV EEMV EEM Yield 4.63% 2.68% 2.59% 1.69% Expense ratio 0.85% 0.29% 0.25% 0.67% Inception Aug 2011 Jan 2012 Oct 2011 April 2003 Assets $32.1M $206.2M $1.90B $31.96B Avg Vol. 28.4K 49.9K 306K 60.6M No. holdings 30 187 243 817 Annual turnover 137% 101% 34% 22% EEM is by far the most massive fund, with nearly $32B in assets. The other three low-volatility EM funds have a wide variation in size. EEMV has $1.90B in assets, followed by EELV at $206.2M in assets. Surprisingly, HILO only has $32.1M assets even though it is the oldest of the three low-volatility funds. The volumes of HILO and EELV border on the low end, with only 28.4K and 49.9K shares changing hands a day, respectively. We can also see that HILO has the highest yield (4.63%) out of the three low-volatility EM funds and EEM, which is not surprising given that it’s also a dividend fund. The other two low-volatility EM funds, EELV (2.68%) and EEMV (2.59%), also have higher dividends than EEM (1.69%). Both HILO and EELV have very high turnovers of 137% and 101%, respectively. EEMV and EEM have lower turnovers of 34% and 22%, respectively. In terms of expense ratio, HILO is the most expensive ETF, with a fee of 0.85% per annum. EELV and EEMV are much cheaper, with expense ratios of 0.29% and 0.25%, respectively. EEM charges 0.67% in expenses, which seems very high for a “vanilla” equity fund. This is probably why Vanguard FTSE Emerging Markets ETF (NYSEARCA: VWO ) has outgrown EEM even though it was incepted two years later. VWO charges only 0.15% in fees and has accumulated over $45B in assets. Overlap The following table illustrates the overlap between the three low-volatility EM funds and EEM. Overlap statistics were obtained from ETF Research Center . HILO EELV EEMV EEM HILO – 5% 7% 2% EELV 5% – 37% 27% EEMV 7% 37% – EEM 2% 27% 31% – We can see that HILO has the lowest overlap compared to the other two low-volatility EM funds. This is probably because HILO also has a dividend focus in addition to its low-volatility theme. EELV and EEMV have the highest overlap, at 37% of total assets. Performance The graph below shows the performance of the three low-volatility EM funds and EEM since Jan 2012 (2 years). HILO Total Return Price data by YCharts We see quite a disparity between the performance of the three funds and EEM over the past 2 years. Both EEMV and EELV have managed to beat the benchmark EEM (6.23%). EEMV exhibited the best 2-year performance of 20.64%, while EELV returned 8.87%. On the other hand, HILO recorded the worst performance of -9.53%. The following table shows further performance and risk data for HILO, EELV, EEMV and EEM. Data are from Morningstar, except for volatility (2Y) and beta (2Y) which are from InvestSpy . HILO EELV EEMV EEM 1-year return % -12.21 -4.14 1.96 -0.94 3-year return (ann.)% -3.42 – 6.18 2.91 Volatility (2Y) % 15.6% 13.5% 13.7% 18.0% Beta (2Y) 0.94 0.80 0.87 1.17 Sharpe ratio (3Y) 0.01 – 0.77 0.37 We can see from the data above that despite their disparate performances, all three low-volatility funds have succeeded in achieving lower volatility than EEM over the past 2 years. Valuation The table below shows various value and growth metrics for HILO, EELV, EEMV and EEM. Data for all funds are from Morningstar (value metrics including dividend yield are forward looking). The first five rows can be considered as value metrics while the last five rows can be considered as growth metrics. HILO EELV EEMV EEM Price/Earnings 11.31 14.45 15.69 12.76 Price/Book 1.27 1.48 1.86 1.49 Price/Sales 0.99 1.18 1.51 1.14 Price/Cash Flow 5.42 5.18 7.38 4.91 Dividend yield % 9.96 3.09 2.81 2.56 Projected Earnings Growth % 11.23 12.34 10.97 11.76 Historical Earnings Growth % 0.73 11.05 5.06 -1.68 Sales Growth % 12.97 -17.34 -15.60 -13.79 Cash-flow Growth % 7.40 3.77 6.36 7.85 Book-value Growth % 8.70 -22.75 -26.56 -21.57 We can see from the table above that EELV has similar valuation metrics to EEM, while EEMV is slightly more expensive than EEM. On the other hand, HILO appears to be the cheapest out of the four funds. Interestingly, the current valuation of the four funds is inversely proportional to their performance over the past two years. HILO, the most “valuey” fund, has had the worst performance in the last two years, while EEMV, the most expensive fund, has done the best. The funds also appear to have many negative growth metrics, which could be due to the effect of a global slowdown on the growth of many emerging market economies that rely heavily on exports or foreign investment. Countries Perhaps the most important factor that would affect the performance of these EM funds is the distribution of the constituent countries in the fund. The following table shows the top 10 countries in each of the three low-volatility EM funds and EEM (data from ETF Database ). HILO EELV EEMV EEM Country Weight Country Weight Country Weight Country Weight Thailand 13.23% Taiwan 27.68% China 22.74% China 17.52% Malaysia 12.61% Malaysia 18.62% Taiwan 17.37% South Korea 13.64% China 12.54% South Africa 13.66% South Korea 9.40% Taiwan 12.20% Brazil 9.60% South Korea 9.30% Malaysia 8.80% Brazil 7.82% Mexico 8.23% Other 9.23% South Africa 5.50% South Africa 7.75% Czech Republic 7.36% China 5.08% Indonesia 4.88% India 6.99% Indonesia 6.96% Brazil 4.47% Brazil 4.44% Mexico 5.05% Chile 6.57% Mexico 3.83% Chile 4.21% Russia 3.94% Poland 5.10% Thailand 2.97% Philippines 3.75% Malaysia 3.66% United Arab Emirates 4.01% Chile 2.83% Qatar 2.80% Indonesia 2.66% The following graph shows the allocation of the four funds to the ten most represented countries in the funds. Size The table below shows the size distribution for the four EM funds (data from Morningstar). HILO EELV EEMV EEM Giant 24.18 26.03 34.16 50.62 Large 11.85 51.75 49.84 37.00 Mid 52.55 22.22 15.40 11.87 Small 9.20 0 0.61 0.44 Micro 2.22 0 0 0.08 And in graphical form: We can see that HILO has a rather interesting size distribution, with more giant and medium-cap stocks compared to large-cap stocks. EELV and EEMV have similar size distributions, with about 50% in large-cap stocks, 30% in giant-cap stocks and 20% in mid-cap stocks. On the other hand, EEM is tilted towards giant-cap stocks. Sector The final aspect to look at for the EM funds is their sector diversification. The following table shows the sector composition of HILO, EELV, EEMV and EEM. Data are from Morningstar. HILO EELV EEMV EEM Basic Materials 8.47 9.41 3.9 7.93 Consumer Cyclical 5.74 10.71 6.32 8.46 Financial Services 16.64 37.14 26.44 25.43 Real Estate 5.68 3.05 1.06 2.44 Communication Services 19.52 8.97 12.98 7.76 Energy 6.08 4.1 3.13 7.51 Industrials 24.19 7.87 7.66 5.73 Technology 0 3.77 13.03 20.9 Consumer Defensive 0 9.21 11.54 8.3 Healthcare 3.64 1.46 6.62 2.24 Utilities 10.05 4.31 7.92 3.31 And in graphical form: We can see from the data that financials make up a high allocation of all four EM funds, with EELV having the highest allocation at 37.14% and HILO having the lowest at 16.64%. HILO has the highest allocations to industrials (24.19%) and communication services (19.52%). The following graph shows the sector distribution of the four funds (individual sectors are not marked). We can see that EEMV and EEM have the most even sector distributions of the four funds. Conclusion All three low-volatility EM funds have managed to deliver lower volatilities over the past 2 years (compared to EEM), but with wildly disparate performances. EEMV exhibited the best 2-year performance of 20.64%, while EELV returned 8.87% and HILO returned -9.53%. If I had to pick a low-volatility EM fund, I would probably pick EEMV for the following reasons: It has the best performance record over the past two years while still recording lower volatility than EEM. Its three highest allocations are to China, Taiwan and South Korea, which are all in the top 5 of the cheapest emerging market countries. It has the lowest expense ratio (0.29%) out of all the EM funds studied. It has better sector distribution compared to HILO or EELV.