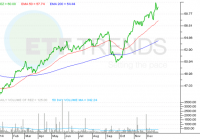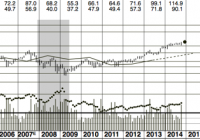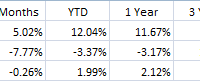
Summary PHT’s 45% premium is three standard deviations above its 1-year average premium. NAV performance has struggled this year, while the market price has increased 12%. 20% of PHT’s portfolio is invested in energy-related securities, increasing the portfolio’s risk. Overview: The Pioneer High Income Trust (NYSE: PHT ) is a high yield bond closed-end fund with a solid track record and a strong management team. High yield funds have struggled recently, as slumping oil prices have raised concerns that highly levered energy companies could default on their debt. Energy companies have been some of the largest issuers of high yield debt in recent years. Expectations of rising interest rates in 2015 have also pressured the high yield market. PHT’s strong performance and high yield have caused shares to trade at a persistent premium since 2009. The fund has a five-year average premium of 23.53%. Recently, the premium has expanded. PHT’s price performance has remained strong, while the underlying NAV performance has struggled along with its high yield peers. The premium has increased to 45.54%. This premium is near the highest ever for this fund and looks vulnerable to a pullback. Key Investment Highlights: High Premium: PHT is currently trading at a 45.54% premium to NAV. This is significantly higher than its 1-year average premium of 29.05% and its 5-year average premium of 23.53%. Evidence of the wider than normal discount, the Z-Statistic of 3.20 shows the current premium is trading more than 3 standard deviations wider than normal. High Yield Performance: Spreads on high yield bonds have contracted as the Fed’s zero interest rate policy has driven investors to reach for yield. Spreads have started to widen as investors contemplate higher interest rates and the potential for increased defaults. These factors have pressured the returns of high yield bonds. PHT’s premium has grown during the years since the financial crisis, driven by consistent strong returns. If returns from high yields are pressured, it is likely PHT’s premium will be pressured as well. Energy Exposure: PHT has significant exposure to energy-related high yield bonds in its portfolio. As of 9/30/2014, 20.02% of the portfolio is invested in energy related holdings. For comparison, the iShares iBoxx High Yield Corporate Bond ETF (NYSEARCA: HYG ) currently has 13.47% of its assets invested in the energy sector. If energy prices remain compressed, PHT’s performance may suffer. Key Investment Risks: Continued Economic Recovery: High yield bonds tend to have strong performance during economic recoveries due to lower default risk. If the economy continues to chug along, high yield bonds may show strong performance, allowing PHT to continue to trade at a significant premium. Energy Price Recovery: A recovery in energy prices would relieve concerns of energy company defaults, allowing energy-related bond prices to recover. Due to PHT’s exposure to energy-related issues a recovery in energy prices would benefit PHT’s NAV performance. Key Portfolio Metrics: Premium/Discount: 45.54% Z-Statistic 3.20 Market Distribution Rate: 9.46% Current Monthly Distribution: $0.1375 Average Earnings/Share: $0.1200 Average Earnings/Distribution: 87.27% UNII Per Share: $0.2238 Effective Leverage: 30.42% Effective Duration: 3.06 Performance: Using ETFs with a similar investment objective can give a good comparison to evaluate management’s performance. HYG is a widely used high yield bond ETF that offers a good comparison for PHT. PHT has a long track record and compares favorably to HYG over the 3- and 5-year periods based on both price and NAV performance. The 10-year track record of 10% per year is attractive and shows the strength of this fund. However, PHT has underperformed over recent time periods likely due to the fund’s riskier holdings and higher energy exposure. The recent divergence between NAV and market performance is what has driven the premium. Data as of 12/26/2014 Source: Morningstar Premium/Discount: (click to enlarge) Source: CEFConnect The fund closed 12/26/2014 at a 45.54% premium to the NAV, or underlying value of the portfolio. This is above the 52-week average premium of 29.05%. The recent divergence between NAV performance and market performance has driven the premium higher. PHT has a strong performance track record that has caused the fund to trade at a persistent premium since 2009. However, the current premium is very high for this fund and investors may want to look elsewhere for their high yield exposure at least until the premium drops down below historical levels. Expense Ratio: PHT pays 0.60% of daily managed assets to Pioneer Investment Management for investment management. The annual expense ratio for PHT as of 3/31/2014 was 1.04. This is a relatively low fee for a high yield closed-end fund. The fee is particularly attractive when considering the strong work that management has done over time. Distribution: PHT pays a monthly distribution of $0.1375/share. The distribution equates to an annual distribution yield of 9.46% based on current market prices and 13.77% based on NAV. PHT’s earnings only cover 87% of the distribution. The fund does have $0.2238 in UNII so the distribution shouldn’t be at risk for a while. If interest rates remain low, PHT may have to reduce its distribution in the future. Leverage: PHT employs leverage through a margin account with Credit Suisse. The fund borrows at three-month LIBOR plus 0.70%. This is a relatively low cost form of leverage in the current market. This does cause concern over the long-term cost of leverage. If interest rates rise, it could increase the cost of leverage to the fund since PHT doesn’t have fixed cost leverage in place. Liquidity: PHT is a moderately sized CEF with $496.37 million in net assets. PHT has 80,000 shares traded on average a day. This represents $1.4 million in daily volume at current prices. This is reasonable liquidity for a CEF and should allow investors to fill orders without problems. It is always wise to use limit orders to purchase or sell shares of closed-end funds, as the bid/ask spread can be wide. Management: PHT is managed by Pioneer Investment Management, a wholly owned subsidiary of UniCredit S.p.A. Pioneer is a well respected fund family with significant fixed income resources and a long track record. The fund appears to be in good hands. Portfolio: Geographic Allocation Source: Pioneer as of 11/30/2014 Most of PHT’s portfolio is based in the United States. PHT has assets invested in several other countries, but none of these countries make up more than 5% of assets. Sector Allocation Source: Pioneer as of 11/30/2014 PHT has broad sector exposure, but the majority of the portfolio is invested in U.S. high yield corporate bonds. One area to watch is the exposure to event-linked bonds. Many of the event-linked bonds in the portfolio are catastrophe bonds. Several of Pioneer’s other funds have significant exposure to catastrophe bonds. These bonds can offer non-correlated high yields, but investors should be conscious of the risks of investing in these bonds. Of particular interest is their non-correlation with high yield bonds. The exposure to catastrophe bonds isn’t high enough to cause concern here, but should be watched to make sure it doesn’t increase over an individual’s risk tolerance. Credit Ratings Source: Pioneer as of 11/30/2014 As would be expected, PHT is mostly invested in high yield bonds. The fund is on the riskier side with 28% of the portfolio invested in CCC rated bonds. Maturity Breakdown Source: Pioneer as of 11/30/2014 The portfolio is invested in relatively short-term bonds. Only 5.7% of the portfolio matures beyond 10 years. The short maturity should help reduce portfolio volatility. However, short maturities increase the risk that yields will not be maintained when proceeds from maturing securities are reinvested. Source: Pioneer as of 11/30/2014 PHT has a diverse portfolio with 363 different securities. The top ten holdings represent only 9.50% of the total portfolio. The portfolio turnover has been low. PHT had a 16% turnover as of 9/30/2014. The highest portfolio turnover in the past five years was 30%. Strategy: PHT’s primary investment objective is to seek high current income with a secondary objective to seek capital appreciation. The fund is able to invest up to 50% of the assets in illiquid securities. The fund is also able to invest in securities of issuers that are in default or that are in bankruptcy. Tax Issues: As of September 30, 2014, the fund had $12,223,142 of net unrealized appreciation in the portfolio. These gains are offset by $46,261,236 in capital loss carryforwards. Conclusion: PHT is a strong fund with capable management. However, the current premium to NAV reduces the attractiveness of the investment at this point. Additionally, portfolio risks don’t appear to be accounted for in the market price. Higher interest rates could pressure high yield returns. The fund’s high exposure to energy related holdings could hurt performance if oil prices remain depressed. If negative NAV performance continues, the fund’s premium would likely erode. This is a fund that I would avoid until there is a significant reduction in the premium.