Tag Archives: europe

Complete List Of 79 ETP Closures For 2014

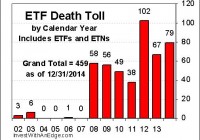
Seventy-nine exchange traded products bit the dust in 2014, marking the second highest annual death toll in the history of the ETF industry. The 72 ETF and 7 ETN closures were second only to the 102 closures of 2012. Broken down by major categories, the closures of 2014 consisted of 22 sector, 15 style and strategy, 14 global and international, 13 bond, 7 inverse, 4 leveraged, and 4 commodity. Of the 2,121 U.S. ETPs launched since the dawn of the industry in 1993, only 1,662 remain listed while 459 have closed. Said another way, the historic probability of ETP survivability is 78.4%. Closures affected 15 brands and sponsors in 2014. Pax World was the only sponsor to exit the ETF space completely, and it did so in a very strange fashion. ETF pundits have long discussed the possibility of a large quantity of mutual funds converting to ETFs. However, no one ever thought conversions might go the other direction, but that is exactly what happened when all $64 million of the assets in the Pax MSCI EAFE ESG Index ETF (NYSEARCA: EAPS ) suddenly became Institutional Class shares of the Pax World International ESG Index Fund (MUTF: PXNIX ), a traditional mutual fund. See ‘ This Wasn’t Supposed To Happen: ETF Converts To Mutual Fund ‘ for additional details. Goldman Sachs is highly regarded on Wall Street, and it is often thought of as a firm that can do no wrong when it comes to making money. However, it hasn’t figured out the ETF space yet. Goldman (NYSE: GS ) attached its name and investment strategies to four ETFs sponsored by ALPS in 2012. Apparently, the Goldman name carries no weight in ETF land , and all four ETFs closed in 2014 with combined assets of less than $11 million. For a number of reasons, the most notable closures of the year belong to iShares. First, 29 iShares ETFs had their last day of listed trading in 2014, giving iShares a 37% market share of closures. No other brands came close to this figure, with Direxion and EGShares tying for second-place “honors” with just six closures each. Second, iShares raised the bar on ETF survivability , as its 18 closings in October averaged more than $18 million in assets and two had about $70 million each. At the time, 49% of all listed ETFs and ETNs had fewer assets. Third, two of the liquidated funds (NY and NYC) had been on the market more than ten years. Longevity does not assure survival. Last, I can recall a BlackRock (NYSE: BLK ) representative questioning why there were iShares funds on ETF Deathwatch when none had ever closed. I reminded him that iShares practically invented ETF closures with three such occurrences in 2002. He rebutted that Barclays owned the iShares brand at that time, and BlackRock had never closed an ETF. Never say never. Some ETPs have maturation dates, namely target-date maturity bond ETFs and all ETNs. At their time of launch, these products inform investors of their likely closure and liquidation dates. For example, the Guggenheim BulletShares series of target maturity bond ETFs retire a couple of funds at the end of each calendar year. The two 2014 BulletShares ETFs (BSCE and BSJE) had their last day of trading on December 30, and next year we can expect the 2015 funds (BSCF and BSJF) to do the same. These are planned from the time of inception and are not indicative of unhealthy or failing products. Every ETN is also issued with a maturity date. Typically, ETNs are launched with 30-year or 20-year maturities. Since the first ETNs didn’t come to market until 2006, most investors thought they wouldn’t have to deal with ETN maturation for another 10 or 20 years. However, in 2009 there were five ETNs issued as 5-year notes scheduled to mature in 2014. Three of these five triggered early terminations, including Barclays ETN+ S&P 500 Short B ETN (NYSEARCA: BXDB ) last April. The two that escaped early termination, BXUC and BXUB, matured in November and were liquidated. Most of 2014’s closures had become Zombie ETFs, and 58 of the 79 (73%) were on ETF Deathwatch at the time of their closure announcements. The major exceptions included the maturing products discussed above and many of the iShares with large amounts of assets. The average age of funds that closed in 2014 was 45.8 months (3.8 years). This is greater than the 31.4-month average lifespan of all 459 closed products, suggesting sponsors are willing to subsidize these non-profitable products longer than in years past. The table below is currently sorted by product name. # Ticker Name Last Day Deathwatch Notes 1 GSAX ALPS/GS Momentum Builder Asia x-Japan Eq/US-T 08/27/2014 Yes 2 GSGO ALPS/GS Momentum Builder Growth Markets Eq/US-T 08/27/2014 Yes 3 GSMA ALPS/GS Momentum Builder Multi-Asset 08/27/2014 Yes 4 GSRA ALPS/GS Risk-Adjusted Return U.S. Large Cap 08/27/2014 Yes 5 BXUB Barclays ETN+ S&P 500 Long B Leveraged ETN 11/20/2014 Yes 2 6 BXUC Barclays ETN+ S&P 500 Long C Leveraged ETN 11/20/2014 – 2 7 BXDB Barclays ETN+ S&P 500 Short B Leveraged ETN 04/10/2014 Yes 3 8 BRZS Direxion Daily Brazil Bear 3x Shares 09/23/2014 Yes 9 EURZ Direxion Daily FTSE Europe Bear 3x Shares 09/23/2014 Yes 4 10 BARS Direxion Daily Gold Bear 3x Shares 12/26/2014 Yes 4 11 JPNS Direxion Daily Japan Bear 3x Shares 09/23/2014 Yes 12 GASX Direxion Daily Natural Gas Related Bear 3x 09/23/2014 – 13 KORZ Direxion Daily South Korea Bear 3x Shares 09/23/2014 Yes 14 CHXX EGShares China Infrastructure 09/29/2014 Yes 15 EMDG EGShares Emerging Markets Dividend Growth 12/24/2014 Yes 16 EMHD EGShares Emerging Markets Dividend High Income 12/24/2014 Yes 17 IEMF EGShares TCW EM Intermediate Term IG Bond 09/29/2014 Yes 4 18 LEMF EGShares TCW EM Long Term IG Bond 09/29/2014 Yes 4 19 SEMF EGShares TCW EM Short Term IG Bond 09/29/2014 Yes 4 20 OFF ETRACS Fisher-Gartman Risk Off ETN 05/18/2014 Yes 21 ONN ETRACS Fisher-Gartman Risk On ETN 05/18/2014 Yes 22 GASZ ETRACS Natural Gas Futures Contango ETN 01/22/2014 – 23 OILZ ETRACS Oil Futures Contango ETN 01/22/2014 Yes 24 CNPF Global X Canada Preferred 10/16/2014 Yes 25 GGGG Global X Pure Gold Miners 10/16/2014 Yes 26 BSCE Guggenheim BulletShares 2014 Corp Bond 12/30/2014 – 2 27 BSJE Guggenheim BulletShares 2014 HY Corp Bond 12/30/2014 – 2 28 GIY Guggenheim Enhanced Core Bond 03/07/2014 Yes 1 29 MUAC iShares 2014 AMT-Free Muni Term 08/15/2014 – 2 30 NUCL iShares Global Nuclear Energy 10/14/2014 Yes 31 FNIO iShares Industrial/Office Real Estate Capped 10/14/2014 Yes 32 AXDI iShares MSCI ACWI ex US Consumer Discretionary 03/25/2014 Yes 33 AXSL iShares MSCI ACWI ex US Consumer Staples 03/25/2014 Yes 34 AXEN iShares MSCI ACWI ex US Energy 03/25/2014 Yes 35 AXFN iShares MSCI ACWI ex US Financials 03/25/2014 Yes 36 AXHE iShares MSCI ACWI ex US Healthcare 03/25/2014 Yes 37 AXID iShares MSCI ACWI ex US Industrials 03/25/2014 Yes 38 AXIT iShares MSCI ACWI ex US Information Technology 03/25/2014 Yes 39 AXMT iShares MSCI ACWI ex US Materials 03/25/2014 Yes 40 AXTE iShares MSCI ACWI ex US Telecom Services 03/25/2014 Yes 41 AXUT iShares MSCI ACWI ex US Utilities 03/25/2014 Yes 42 EMFN iShares MSCI Emerging Markets Financials 10/14/2014 Yes 43 EMMT iShares MSCI Emerging Markets Materials 10/14/2014 Yes 44 FEFN iShares MSCI Far East Financials 10/14/2014 Yes 45 NY iShares NYSE 100 ETF 10/14/2014 – 46 NYC iShares NYSE Composite ETF 10/14/2014 – 47 RTL iShares Retail Real Estate Capped 10/14/2014 Yes 48 TZD iShares Target Date 2010 10/14/2014 – 49 TZE iShares Target Date 2015 10/14/2014 – 50 TZG iShares Target Date 2020 10/14/2014 – 51 TZI iShares Target Date 2025 10/14/2014 – 52 TZL iShares Target Date 2030 10/14/2014 – 53 TZO iShares Target Date 2035 10/14/2014 – 54 TZV iShares Target Date 2040 10/14/2014 – 55 TZW iShares Target Date 2045 10/14/2014 Yes 56 TZY iShares Target Date 2050 10/14/2014 – 57 TGR iShares Target Date Retirement Income 10/14/2014 – 58 RKH Market Vectors Bank and Brokerage 12/12/2014 Yes 59 COLX Market Vectors Colombia 12/12/2014 Yes 60 GERJ Market Vectors Germany Small-Cap 12/12/2014 Yes 61 LATM Market Vectors Latin America Small-Cap 12/12/2014 Yes 62 CHLC Market Vectors Renminbi Bond 12/12/2014 Yes 63 EAPS Pax MSCI EAFE ESG Index ETF 03/21/2014 – 5 64 AUD PIMCO Australia Bond Index 09/26/2014 – 65 TRSY PIMCO Broad U.S. Treasury Index 03/10/2014 Yes 66 BABZ PIMCO Build America Bond 09/26/2014 – 1 67 CAD PIMCO Canada Bond Index 09/26/2014 – 68 BUND PIMCO Germany Bond Index 09/26/2014 Yes 69 PIQ PowerShares Dynamic Magniquant 02/18/2014 Yes 70 KBWX PowerShares KBW International Financial 02/18/2014 Yes 71 PXN PowerShares Lux Nanotech 02/18/2014 Yes 72 PMNA PowerShares MENA Frontier Countries 02/18/2014 Yes 73 GEMS PureFunds ISE Diamonds/Gemstone 01/23/2014 Yes 74 MSXX PureFunds ISE Mining Service 01/23/2014 Yes 75 NAGS Teucrium Natural Gas 12/18/2014 Yes 76 CRUD Teucrium WTI Crude Oil 12/18/2014 Yes 77 ASDR VelocityShares Emerging Asia DR ETF 11/20/2014 Yes 78 EMDR VelocityShares Emerging Markets DR ETF 11/20/2014 Yes 79 RUDR VelocityShares Russia DR ETF 11/20/2014 Yes Notes: 1) actively managed, 2) reached planned maturity, 3) hit early termination trigger, 4) launched in 2014 and less than 1 year old at time of closure, 5) converted to mutual fund. All exchange traded notes are identified with “ETN” as part of their name description. Disclosure covering writer, editor, publisher, and affiliates: No positions in any of the securities mentioned. No positions in any of the companies or ETF sponsors mentioned. No income, revenue, or other compensation (either directly or indirectly) received from, or on behalf of, any of the companies or ETF sponsors mentioned.

An ETF For European QE

Summary European QE appears likely at the next meeting. In order to overcome German opposition, the QE program may favor northern European bonds and stocks more than anticipated. The bear market in the euro will continue in the wake of QE. Back in December, ECB President Mario Draghi said consensus wasn’t needed for a QE program. The stumbling block in Europe has been several hard money nations led by Germany . These are the countries often lumped together as part of a northern euro block, such as Holland, Austria and Finland, who prefer a strong euro to a weak one. On the other side are the Greeks, Italians, Spanish and French who would do better with a weaker euro. Global investors are giving the south of Europe its wish by selling the euro, but a QE program would be a big help to nations struggling with unsustainable sovereign debts. If a QE program is launched, it will be good news for European equities, and due to the need to overcome German-led opposition, may benefit the north much more than expected. Will There Be European QE? The impetus for a QE policy in Europe is the persistently low inflation on the continent. Falling oil prices knocked consumer inflation below zero in December, which is generally a good thing for the economy, but in the bizarro world of heavily indebted nations, is a scary prospect. Since debt continues to pile up, a rise in purchasing power means the outstanding debt grows in real terms even with no new borrowing. With even the efficient German economy looking at 1 percent GDP growth in 2015, there is a desire for higher inflation and higher nominal growth rates in Europe. To satisfy the demand, the ECB may try an asset purchase program and it has room to expand its balance sheet : … the central bank can still ease policy by expanding the size of its own balance-sheet, which it intends returning to the high of €3 trillion ($3.7 trillion) that it reached in early 2012. That amounts to an extra €1 trillion, though no date has been specified for accomplishing the increase. The previous peak occurred as the ECB averted a funding crisis for banks by providing them with €1 trillion in three-year loans in the winter of 2011-12. Since then its balance-sheet has been waning as banks in northern Europe repaid the money early. One issue the ECB faces is that there is no “European” bond. In order to do QE, it must buy the bonds of member states, but how does it do this fairly? One rumored method is to use the national central bank’s contributions to the ECB, which would mean German bonds would receive the biggest dose of QE money (though not necessarily the biggest dose relative to GDP or outstanding debt). German bonds are already expensive. The yield on 10-year German bonds is below 0.5 percent in part due to low inflation, but also due to investors worried about a breakup in the euro and attracted to northern Europe’s ability to repay its debts. Were the eurozone to break apart, the northern European currencies (or a northern euro) would appreciate in value, while the southern European currencies (or southern euro) would depreciate in value. The German bonds could also be trading down on the anticipation of European quantitative easing. Whatever the reason, investors clearly favor the north over the south and they do so even with rumored QE on the way. As German bond yields fall faster than southern European bond yields, it raises the question of where QE money will go. If the bonds aren’t falling as a result of fears of a possible breakup or Grexit, and QE money is doled out based on contributions, it could mean the bulk of QE money will not make it to southern Europe and instead flow into the assets preferred by investors holding German bonds. Southern Europe will benefit from QE, but the biggest winners might be northern European equity and bond markets. An Important Week For the European Markets The ECB meets on January 22 and three days later, the Greeks vote. Whatever happens, one of the least likely outcomes is business as usual: no QE and a win for the Greek political establishment. A QE policy would smooth financial market concerns ahead of a Greek vote (if they think it helps Syriza, will they delay QE?), and if QE is initiated, it is likely to favor the nations that need it least. The unpredictable Greek election is a major short-term risk for the euro. Although Syriza has maintained a small lead in the polls, the follow on results are unpredictable because party leader Alexis Tsipras’ rhetoric may not match his actions, and the response of the troika is unknown. Adding to the lack of clarity, German officials leaked their opinion that a Greek exit from the euro isn’t the end of the world. ETF Strategy After breaking below the 2010 lows set at the depths of the first Greek sovereign debt crisis, the euro is in a clear bear market with parity looming in the not too distant future. QE or no QE, fundamentals are moving in favor of the dollar and against the euro, with faster GDP growth and higher interest rates as two of the main positives for the greenback. One way to bet against a weak euro is via ETFs such as the PowerShares DB USD Bull ETF (NYSEARCA: UUP ) or the ProShares UltraShort Euro ETF (NYSEARCA: EUO ). While the announcement of a European QE program may be short-term bullish for the euro because traders may “buy the news,” equities have been weak due to the looming Greek election. A QE policy would be net positive for equities because it would increase confidence in the market. While it could lag in the short-term from a euro bounce, the WisdomTree Europe Hedged Equity ETF (NYSEARCA: HEDJ ) is the best option for a bull market in European stocks and a bear market in the euro. Index & Strategy HEDJ has tracked the WisdomTree Europe Hedged Equity Index since August 29, 2012. The main attraction of HEDJ is the currency hedge. An investor in HEDJ receives only the nominal change in the euro denominated value of the stocks. This doesn’t eliminate currency risk; it shifts it. When the euro is weak, HEDJ will beat an unhedged European equity fund, but when the euro is strong, HEDJ will under perform an unhedged European equity fund. The index takes the currency approach a step further though. Here’s an important part of the index description : The Index is based on dividend paying companies in the WisdomTree DEFA Index that are domiciled in Europe and are traded in Euros, have at least $1 billion market capitalization, and derive at least 50% of their revenue in the latest fiscal year from countries outside of Europe . Not only does HEDJ hedge away euro risk, it also holds stocks in companies most likely to benefit from a weaker euro because they export or have extensive multinational operations. We can see how this changes the portfolio by comparing HEDJ to an unhedged eurozone fund, the i Shares MSCI EMU ETF (NYSEARCA: EZU ). Here’s the country exposure for each fund, based on data from the fund providers’ websites as of January 12. The EZU numbers do not add to 100 percent because EZU lists “Other” at 1.30 percent of assets. Both ETFs have heavy exposure in the larger economies of France and Germany, but HEDJ is more balanced in its approach. Sector exposure is another story. HEDJ has about 12 percentage points less in financial than EZU. Financials are more closely tied to the domestic economy and some fall afoul of HEDJ’s rule for owning companies with non-European sourced revenue. That rule also causes the fund to be underweight utilities and energy relative to EZU. HEDJ is overweight the consumer staples, industrial and consumer discretionary sectors, which are represented in the portfolio by major multinational firms such as Anheuser-Busch InBev (NYSE: BUD ), Unilever (NYSE: UL ) and L’Oreal ( OTCPK:LRLCY ). Although financials may be among the beneficiaries of a QE program, HEDJ’s exposure to multinationals is attractive because Europe’s economic prospects aren’t great. Even with QE, the eurozone will be lucky to generate low inflation and growth. The story here is that equity valuations will rise due to liquidity added to the market and increased confidence generated by the central bank’s actions. Unlike the U.S., a breakup of the currency union is a low probability, but high cost event that weighs on European equities whenever fear of a potential breakup spikes. Performance This first chart is a price ratio of HEDJ to EZU. A rising line shows the outperformance of HEDJ. The black line is the EUR/USD exchange rate. This shows changes in the exchange rate, explain the direction of relative performance. HEDJ leads when the euro falls. (click to enlarge) The return chart below shows that the different sector exposure has caused total returns to fluctuate more than by the exchange rate. Since inception as the Europe hedged fund in August 2012 through January 12, HEDJ is beating EZU by more than 10 percent, but the euro is down less than 6 percent over this period. Back in May 2014, EZU was beating HEDJ by about 17 percent since inception, but the euro was only up 10 percent. This behavior is consistent with HEDJ’s index rule on non-European revenues. (click to enlarge) Expenses HEDJ charges 0.58 percent versus 0.48 percent for EZU, a small increase for adding the currency hedging. Risk & Reward This decision tree shows which exposure makes the most sense for different currency and equity situations. Active investors bullish on European equities and bearish on the euro should opt for a fund such as HEDJ. Those investors also bullish on the euro should stick with an unhedged ETF such as EZU. For investors bearish on stocks, but bullish on the euro, holding a currency fund such as the CurrencyShares Euro Trust ETF (NYSEARCA: FXE ) or a bond fund holding euro-denominated bonds is the best option. For those bearish on both stocks and the euro, holding a currency short fund such as EUO is an option, but for many investors, simply avoiding Europe altogether is the best option. (click to enlarge) Conclusion A European QE program will be bullish for European equities, but equities face a major risk from the Greek election. Odds are Europe will choose the easier path of accommodating a political shift in Greece, but there’s a small chance that either Greece or the troika scuttle the bailout agreements. Assuming the extreme path is avoided though, confidence will recover once the Greek election is over and a QE program will further increase it. Meanwhile, QE will be bearish for the euro over the intermediate to long-term. HEDJ is perfectly situated to benefit in an environment of a weak euro and rising European equities.