Tag Archives: etf-hub

RPG Is A Solid Growth ETF That Thoroughly Outperformed SPY Over The Last 9 Years

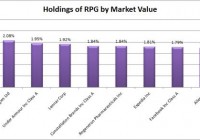
Summary The ETF looked solid all around. The standard deviation is a bit high relative to SPY, but that should be expected for tracking a smaller portion of the index. The strong liquidity may reflect many investors coming to the same conclusion about the ETF. It looks worthy of deeper consideration. Diversification within the ETF is solid, but investors should be aware that the portfolio turnover is very high. Investors should be seeking to improve their risk-adjusted returns. I’m a big fan of using ETFs to achieve the risk-adjusted returns relative to the portfolios that a normal investor can generate for themselves after trading costs. A substantial portion of my analysis will use modern portfolio theory, so my goal is to find ways to minimize costs while achieving diversification to reduce my risk level. In this article, I’m reviewing the Guggenheim S&P 500 ® Pure Growth ETF (NYSEARCA: RPG ). What does RPG do? RPG attempts to track the investment results of S&P 500 ® Pure Growth Index. The ETF falls under the category of “Large Growth”. Standard deviation of monthly returns (dividend adjusted, measured since April 2006) The standard deviation isn’t going to make a strong case for investing in RPG. For the period I’ve chosen, the standard deviation of monthly returns was 5.210%. For SPY, it was 4.416% over the same period. The higher level of volatility for RPG is a challenge since the correlation between the two funds is 94.87%. Yield & Taxes The distribution yield is .69%. I prefer higher yields so that they are more appealing for retiring investor portfolios. Sure, they could sell shares to generate income, but that may create a temptation to change the portfolio strategy at the wrong time. Expense Ratio The ETF is posting a gross expense ratio of .35% and a net expense ratio of .35%. Unfortunately, most ETFs have expense ratios higher than I’d like to see. This is another case where I prefer lower, but it isn’t going to be high enough to make me eliminate an ETF that otherwise has a fairly strong performance. The expense ratio for RPG isn’t all profit to the manager of the fund either. The fund should be incurring substantially more costs than a passive index fund because the portfolio turnover has been running at 46%. The holdings of RPG one year may be very dramatically different than the holdings in the following year. For comparison, only 19.2% of the portfolio value is in the top 10 holdings. The fund could completely exit those positions twice per year and still have a lower portfolio turnover. Market to NAV The ETF is trading at a .06% premium to NAV currently. I think any ETF is significantly less attractive when it trades above NAV and more attractive below NAV. A .06% premium is not enough to matter though. Investors should check prior to placing an order, but the liquidity in RPG should be a great hedge against any meaningful premiums or discounts. Liquidity The liquidity is excellent. I see no concerns. Average volume has been around 100,000 shares per day with share prices around $82 per share. That’s over $8 million changing hands each day. Largest Holdings The diversification within the ETF is pretty solid. Where else will you find an ETF that includes Apple (NASDAQ: AAPL ) but only has it in 10th place for weighting? (click to enlarge) Conclusion This is another Guggenheim ETF worthy of consideration. While I’d like to see lower expense ratios, I find them reasonable for the level of turnover in the holdings. On an economic level, I find it doubtful that investors will produce alpha over the long term through frequent trading when accounting for the costs of that trading. On the other hand, RPG is precisely the fund to contract me on that. Just look at the returns on the fund and you’ll see what I mean: (click to enlarge) RPG thoroughly outperformed SPY over the sample period. I’ve included comparisons that use RPG for smaller portions of the portfolio since I think few investors would decide to invest their entire portfolio into RPG. The correlation is fairly high, but it is also expected since the ETF is tracking part of the same index. The standard deviation of returns is fairly high relative to SPY, but can be tolerated if expected returns are higher. Since the ETF is on the Schwab One Source list, regular rebalancing is definitely an option for funds with strong liquidity. All around, this appears to be a solid ETF for investors that are willing to accept additional volatility and believe that the regular trading can lead to higher risk-adjusted returns. Disclosure: The author has no positions in any stocks mentioned, and no plans to initiate any positions within the next 72 hours. (More…) The author wrote this article themselves, and it expresses their own opinions. The author is not receiving compensation for it (other than from Seeking Alpha). The author has no business relationship with any company whose stock is mentioned in this article. Additional disclosure: Information in this article represents the opinion of the analyst. All statements are represented as opinions, rather than facts, and should not be construed as advice to buy or sell a security. Ratings of “outperform” and “underperform” reflect the analyst’s estimation of a divergence between the market value for a security and the price that would be appropriate given the potential for risks and returns relative to other securities. The analyst does not know your particular objectives for returns or constraints upon investing. All investors are encouraged to do their own research before making any investment decision. Information is regularly obtained from Yahoo Finance, Google Finance, and SEC Database. If Yahoo, Google, or the SEC database contained faulty or old information it could be incorporated into my analysis.

MORT: An ETF Yielding 10% That Is Worthy Of Replicating

Summary MORT offers investors exposure to several mREITs, but the portfolio only holds 25 total mREITs. An investor planning on a long term investment could find significantly better performance by negotiating with a brokerage for free trades. If I were building an ETF for mREITs, I would make some major changes to the allocation. If you’re contemplating investing in the mREIT industry, you should know that there are significant benefits to diversification as each mREIT has a different strategy. One way for investors to achieve that level of diversification is to buy the Market Vectors Mortgage REIT Income ETF (NYSEARCA: MORT ). The ETF offers investors a fairly solid dividend yield and some diversification between mREITs, but as an mREIT analyst I’m not blown away with the investment opportunity. Challenges for MORT The first challenge is that the ETF is trading at a premium of about .4% to the NAV. That’s a large enough premium for investors to be wary of investing. Since inception, the average premium to NAV has been .06%. I don’t see any reason for investors paying a .4% premium to believe that they will recoup the premium when they sell shares. The second challenge is that investors planning to hold shares indefinitely have a superior option. The ETF only holds 25 securities. If investors are dedicated to building an income portfolio from mREITs, they can contact a few brokerage firms and arrange an offer to receive a substantial volume of free trades for opening an account there or moving an existing account to the brokerage. If the investor puts in the time to arrange an account with free trades, they have the opportunity to buy up the holdings without paying the .4% premium. Of course, investors may recognize that the work required to set up the new account would be substantial and the return on their time wouldn’t be that attractive. The return on time wouldn’t be that bad If investors are serious about building a large mREIT portfolio and holding it for a long time, the work of managing the portfolio is fairly simple. The investors would simply need to determine if they wanted dividends reinvested or not and check the appropriate box. There would be no other need to manage the portfolio, which makes it very desirable for long term investors to avoid the substantial expense ratio. The expense ratio The Market Vectors Mortgage REIT Income ETF charges investors a net expense ratio of .41%, but has a gross expense ratio of .60%. Some analysts will tell investors that they should only be concerned with the net expense ratio of an ETF. In the short term, it is reasonable to assume that the costs that are relevant to investors are the costs they are paying to have the ETF managed. For investors looking for a long term holding, the gross expense ratio provides an indication of where the expense ratio might go in the future. I checked the prospectus to look at the terms for maintaining the net expense ratio. The expense ratio is contracted through September 1st, 2015. After that point, it is expected to continue at .41% until the Fund’s Board of Trustees acts to discontinue all or part of the limitation to the expense ratio. That gives me confidence that the expense ratio will be limited to .41% until it ceases to be. Basically, the expense ratio is stuck at .41% until it changes. Let’s say the returns on the mREIT industry are actually decent over the next 20 years and we see values (with dividends reinvested) rising by a 9% annual growth rate. An investor holding the individual stocks with no expense ratio would see their investment climb to 560.44% of the starting value. The investor paying the expense ratio of .41% per year would have their portfolio value climb to 519.75% of the starting value. In my opinion, that is a fairly substantial difference in the ending values of the portfolio. While saving .4% on the initial investment may not be worth negotiating a deal for free trades may not be worth it to save .4%, it should be worth it when the ending portfolio value is growing by over 7.8%. My views You can put me down for bearish if I’m comparing the performance of MORT to the performance of the mREIT industry. You can put me down for thoroughly bullish if I’m comparing the investment to holding cash for a decade. Returns should be positive, but I would expect them to fall short of a reasonable index for measuring the performance due to the expenses. Holdings The following chart shows the top 10 holdings of the portfolio by market value. They represent over 72% of the total value of the ETF. (click to enlarge) If I were building a mortgage ETF, I would lower the weight on Annaly Capital Management (NYSE: NLY ). I would still include it for diversification, but weighting the mREITs by market cap is far from an optimal strategy and doesn’t produce the highest risk adjusted returns. The best weighting system possible for the mREITs would be to have a portfolio manager that is extremely familiar with the mREITs going through each mREIT and considering their exposure to interest rate and credit risk factors. Then an entire portfolio of mREIT companies could be designed to avoid excessive concentration of risk factors that could have been effectively diversified. That would require an enormous amount of work, but would be worthwhile for an enormous ETF tracking mREITs. That may be part of the problem; a market cap of $116 million leaves MORT substantially less liquid than many of the mREITs it is holding. It also means the .41% expense ratio is only providing gross fees of under $500,000. Given that the ETFs will have administrative and trading costs in management, it may be difficult for a fund to provide returns to the sponsor while also paying an expert to design the exposures and to reevaluate those exposures on an annual basis. If a major producer of ETFs like Vanguard or Schwab decided to get into this space, I believe they could put together that combination of mREITs and generate a large enough volume of assets under management to provide a suitable return. Comparing MORT to REM Another option for investors in this space is the iShares Mortgage Real Estate Capped ETF (NYSEARCA: REM ). My views on REM are not substantially different from my views on MORT. REM is offering investors a .48% expense ratio on both gross and net, so higher than MORT currently but without a scheduled increase. It should be noted that the scheduled increases are often delayed, so it is unclear which ETF will have a lower expense ratio a year from now. When it comes to the holdings of the two mREITs, I would consider REM’s portfolio to be slightly more attractive because it holds 38 companies (relative to 25 for MORT) and it has a lower allocation to the top equities. At the present time, I think the ETFs that are available may be superior to investor blindly picking a single holding. However, the high expense ratios and concentration in the largest mREITs make each ETF less desirable as a long term holding. Investors planning on a very long term holding should become familiar with the industry and build their own portfolio. Conclusion I would expect positive total returns for shareholders of MORT over a long time period, but I would expect dramatically better performance by an investor that focused on buying and holding positions in the underlying stocks. If I was designing this portfolio, I would probably overweight holdings like Blackstone Mortgage Trust (NYSE: BXMT ) since their portfolio has substantial diversification benefits . Then I would overweight Dynex Capital (NYSE: DX ) and CYS Investments (NYSE: CYS ) for having internal management teams that are better aligned with shareholder interests. I’d keep American Capital Agency (NASDAQ: AGNC ) as a heavy weight despite the external management structure because the team has a solid track record of success. I wouldn’t overweight Annaly Capital Management despite the large market cap because the mREIT combines an external management agreement with a CEO that has a short track record at the helm and negative returns over the few years she has been leading the mREIT. Disclosure: The author is long DX. (More…) The author wrote this article themselves, and it expresses their own opinions. The author is not receiving compensation for it (other than from Seeking Alpha). The author has no business relationship with any company whose stock is mentioned in this article. Additional disclosure: Information in this article represents the opinion of the analyst. All statements are represented as opinions, rather than facts, and should not be construed as advice to buy or sell a security. Ratings of “outperform” and “underperform” reflect the analyst’s estimation of a divergence between the market value for a security and the price that would be appropriate given the potential for risks and returns relative to other securities. The analyst does not know your particular objectives for returns or constraints upon investing. All investors are encouraged to do their own research before making any investment decision. Information is regularly obtained from Yahoo Finance, Google Finance, and SEC Database. If Yahoo, Google, or the SEC database contained faulty or old information it could be incorporated into my analysis.

Tuttle Tactical ETF Touts Combination Of Capital Gains And Yield

By DailyAlts Staff In today’s low-interest rate environment, coupon payments alone are unlikely to be enough to meet the objectives of yield-hungry investors. Income investors need a combination of yield and capital gains, going forward, and that’s exactly what the Tuttle Tactical Management Multi-Strategy Income ETF (NASDAQ: TUTI ) is designed to provide. In addition to current income, the Tuttle Tactical Management Multi-Strategy Income ETF is designed to provide tactically managed exposure to the markets. Launched jointly by ETF Issuer Solutions and Tuttle Tactical Management on June 10, the former is the ETF’s advisor and the latter is the sub-advisor. Tuttle CEO Matthew Tuttle is the fund’s portfolio manager. “The need for income investing strategies that can allocate tactically in the face of increasingly complex market conditions is clear,” said Mr. Tuttle, in a June 10 press release announcing the new ETF’s launch. “We believe that this ETF is debuting at a critical time for income-minded investors.” The Tuttle Tactical Management Multi-Strategy Income ETF will follow a rules-based investment approach using Tuttle Management’s four uncorrelated tactical models: Income Relative Momentum , which uses monthly relative strength to select one or more income ETPs; Dividend Counter-Trend , which invests in dividend-paying stocks when markets are trending lower intraday, and cash when markets are trending higher intraday; Dividend Tactical Fundamental Earnings , which invests in dividend ETPs when markets are trending higher on weekly models, while earnings are trending downward; and in cash when the reverse is true; and Dividend Absolute Momentum , which invests in dividend ETPs when markets are trending higher on weekly models, and in cash when markets are trending lower, in accordance with their relative strength. These models are based on Tuttle’s investment philosophy, which holds that markets move in recognizable short-term trends and countertrends; but that over the intermediate term, strong asset classes tend to stay strong, while weak asset classes tend to continue in weakness; and over the even-shorter term, markets are dominated by short-term disruptions and other noise. Tuttle’s models attempt to capture gains associated with these outlooks over varying time spans. “The bond market remains challenging for investors, and we know that interest rates will rise,” said Mr. Tuttle. “There is no doubt that the industry appetite for tactical solutions has picked up.” Mr. Tuttle also cited “strong interest” in his firm’s first ETF, the Tuttle Tactical U.S. Core ETF (NASDAQ: TUTT ), which debuted in February. William J. Smalley, President of ETF Issuer Solutions noted that ETF’s success in saying his firm is “very happy to have added TUTI to our listing of featured managers.” The expense ratio for the fund is 1.28%, inclusive of a 0.90% management fee. For more information, download a pdf copy of the fund’s prospectus .