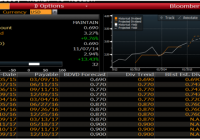
Energy stocks have been pummeled by lower oil prices. Now, energy companies may be forced to cut dividends. The highlight of oil sector ETFs and potential areas of weakness. By Todd Shriber & Tom Lydon Already under considerable pressure with oil prices falling and valuations on the rise, energy sector exchange traded funds are confronting a new problem: The potential, emphasis on “potential,” for dividend cuts from some of the sector’s largest companies. Major equity-based energy ETFs from the Energy Select Sector SPDR ETF (NYSEARCA: XLE ) to the Vanguard Energy ETF (NYSEARCA: VDE ) and the Fidelity MSCI Energy Index ETF (NYSEARCA: FENY ) could be stung by dividend cuts from marquee holdings if oil prices remain and/or fall further, forcing producers to look for ways to conserve cash. If the options market is accurate, the specter of energy sector dividend reductions must be acknowledged. Perusing 2016 at-the-money options data, the options market is pricing in dividend cuts for some of the biggest U.S. oil companies and some of the largest holdings in the aforementioned ETFs. For example, Bloomberg data indicate, based on the company’s recent dividend growth trajectory, Occidental Petroleum (NYSE: OXY ) will grow its payout to $3.20 per share per year over the next 12 months from the current level of $2.88 per share. However, the options market says Occidental’s payout could fall to $2.60. ConocoPhillips (NYSE: COP ), the largest U.S. independent oil and gas producer, assuming the options market is accurate, will also see its annual payout fall to $2.60 from $2.92 per share. ConocoPhillips and Occidental are XLE’s sixth- and seventh-largest holdings, respectively, combining to make up 7.3% of the largest energy ETF ‘s weight. Schlumberger (NYSE: SLB ), the world’s largest oilfield services provider, recently announced a 25% dividend increase, bringing its payout to $2 per share per year. The options market is not impressed, and sees the potential for that dividend to fall to $1.40 a share. Schlumberger is XLE’s third-largest holding, at a weight of almost 7.2%, and the largest holding in the Market Vectors Oil Services ETF (NYSEARCA: OIH ) , at 20.2% of that fund’s weight. OIH and rival oil services ETFs have already endured ample dividend cut speculation, some of which was confirmed in November when Seadrill (NYSE: SDRL ) said it was suspending its $1 per share quarterly dividend until at least the end of 2015. Analysts have noted Diamond Offshore’s (NYSE: DO ) special dividend policy is at risk, while highlighting Transocean (NYSE: RIG ) as a potential dividend cutter . In what could be a real shocker, the options market is also pricing in potential dividend cuts by Exxon Mobil (NYSE: XOM ) and Chevron (NYSE: CVX ), the two largest U.S. oil companies. Based on recent dividend growth, it would be reasonable to expect Exxon’s and Chevron’s dividends to rise to $3 and $4.52, respectively, over the next year. However, options data say $2.71 and $3.99, both below current levels, could be in the cards for Exxon and Chevron. Exxon and Chevron combined for 30.3% of XLE’s weight as of Monday and 34.8% of VDE at the end of December. Several factors should not be overlooked, not the least of which is that the options market could be proven wrong. Second, the companies mentioned here have options for cash conservation before moving to dividend cuts, including reducing capital expenditures and trimming buybacks. Exxon is one of the largest repurchasers of its own shares in the U.S. Third, several of these companies have proven they are highly committed to consistently raising their dividends. For example, Exxon and Chevron are members of the S&P Dividend Aristocrats Index, which requires dividend increase streaks of at least 25 years for inclusion. With its new dividend, Schlumberger’s payout has nearly doubled since 2008. Occidental’s dividend has more than doubled since 2010. Still, even the thought of dividend cuts comes when energy stocks are vulnerable to negative earnings revisions and valuations that are high despite slumping oil prices. “The forward 12-month P/E ratio for the S&P 500 now stands at 16.6, based on (last week’s closing price (2063.15) and forward 12-month EPS estimate ($124.04). Given the high values driving the ‘P’ in the P/E ratio, how does this 16.6 P/E ratio compare to historical averages? What is driving the increase in the P/E ratio? The current forward 12-month P/E ratio of 16.6 is now well above the three most recent historical averages: 5-year (13.6), 10-year (14.1), and 15-year (16.1)” – Rareview Macro founder, Neil Azous. (click to enlarge) Chart Courtesy: Bloomberg