Tag Archives: energy

A Word Of Caution About New Purchases In The Utility Sector

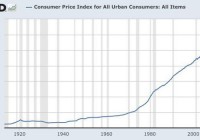
My first purchase of an electric utility stock was 400 shares of Duke Energy (NYSE: DUK ) around 1978. Somewhere along the way, I sold those shares for reasons that I no longer recall. I am not expressing a word of caution about the long term benefits that have flowed through buying and holding quality utility stocks and reinvesting the dividends. The ten year annualized total return numbers for a number of electric utility stocks are superior to the 7.83% annualized total return of the S&P 500 ETF (NYSEARCA: SPY ) through 2/13/15. Some examples include the ten year annualized performance numbers of American Electric Power (NYSE: AEP ), Dominion Resources (NYSE: D ), Edison International (NYSE: EIX ), NextEra Energy (NYSE: NEE ) and Wisconsin Energy (NYSE: WEC ) Ten Year Annualized Total Returns Through 2/13/15 Computed by Morningstar: AEP +8.09% D + 9.93% EIX + 8.72% NEE +12.15% WEC +13.03% Several other well known “utility” stocks have come close to matching the S & P 500 ten year annualized total return without the same decree of drama. AT&T +7.69% SCANA +6.86% Southern Co +6.75% Verizon Communications +7.54% The question that I am addressing now is whether new buys can be justified based on current yields and valuations. I started to look at this question a few days ago when making a comment here at SA about the impact of rising rates on REIT and utility stocks. Both of those industry sectors have attracted a large number of investors searching for yield. For many investors, REITs and utility stocks are viewed as “bond substitutes”. I started an analysis simply be looking at the current yield of the Utilities Select Sector SPDR ETF (NYSEARCA: XLU ), a low cost sector fund that owns primarily electric utility stocks. Yield: As of 2/12/15, the sponsor calculated the dividend yield at 3.28%. The attractiveness of that yield will depend on an investor’s view about the direction of interest rates. Notwithstanding the abundance of contradictory evidence, the Bond Ghouls have been predicting that a Japan Scenario will envelope the U.S. until the end of days, a slight exaggeration, based on the pricing of a thirty year treasury bond at a record low 2.25% yield recently. If an investor believes that deflation will alternate with periods of abnormally low inflation for the next 30 years, then the pricing of several long term sovereign bonds may at least appear to be rational rather than delusional. The current yields of a U.S. electric utility stock, with modest earnings and dividend growth, may even look good compared to those yields and the dire future predicted by those sovereign bond yields (U.S., Germany, Switzerland, Netherlands, Japan, etc.) The 30 year German government bond closed last Friday at a .92% yield. German Government Bonds – Bloomberg The average annual inflation rate in Germany between 1950-2015 was 2.46%. Just assume for a moment that the future will be similar to the past, with some hot and low inflation numbers and possibly a brief period of slight deflation. The .92% 30 year German government bond would produce a 1.54% negative annualized real rate of return before taxes. The average annual U.S. inflation rate between 1914-2015 was 3.32%. When the 30 year treasury hit a 2.25% earlier this year, and assuming the historical average annual rate of inflation, the total annualized return before taxes would be -1.07%. The first item for investors to consider is why are so many predicting the Japan Scenario given the recent U.S. economic numbers and the non-existence of a single annual deflation number since 1955 other than the understandable -.4% reported for 2009. Consumer Price Index, 1913- | Federal Reserve Bank of Minneapolis When looking a long term charts, it is hard to see the underlying support for what the Bond Ghouls are saying about the future. (click to enlarge) (click to enlarge) (click to enlarge) The DSR ratio highlights that U.S. households have more disposable income after debt service payments to pay down debt, to spend, or to save. I view this chart as bullish long term for stocks but not far bonds. I have been making the same point here at SA for over three years now without convincing a single bear of my point. An example of banging my head against the wall was a series of comments to this SA article published in February 2013: Sorry Bulls, But This Is Still A Secular Bear Market-Seeking Alpha It is interesting to go back and read some of those comments from other investors. Yes, I am referring to the bears here who were predicting a bear market starting in 2012 just before the S & P 500 took off on a 700 points move up, not down by the way. (click to enlarge) (click to enlarge) (click to enlarge) (click to enlarge) (click to enlarge) Links to some other relevant charts: Financial Stress-St. Louis Fed Household Financial Obligations as a percent of Disposable Personal Income-St. Louis Fed Mortgage Debt Service Payments as a Percent of Disposable Personal Income-St. Louis Fed Charge-Off Rate On All Loans, All Commercial Banks-St. Louis Fed Retail Sales: Total (Excluding Food Services)-St. Louis Fed E-Commerce Retail Sales-St. Louis Fed Light Weight Vehicle Sales: Autos & Light Trucks- St. Louis Fed Corporate Net Cash Flow with IVA -St. Louis Fed ISM Non-manufacturing-St. Louis Fed And what are the current economic statistics (not the ones generated through reality creations) that support the long term Japan Scenario prediction that underlies current intermediate and long term bond prices? I will just drag and drop here my recent discussions of this data. Is that dire long term U.S. inflation and growth forecasts embedded in those historically abnormal yields justified by the 5% real Gross Domestic Product growth in the 3rd quarter perhaps slowing to 3% in the 2014 4th quarter with personal consumption expenditures accelerating; the lowest readings on record in the debt service payments to disposable income ratio (DSR) ; the decline in the unemployment rate to 5.7% with 257,000 jobs added in January with a 12 cent rise in average hourly earnings and a 147,000 upward revision for the prior two months; a decline in the 4-week moving of initial unemployment claims to the historical lows over the past four decades; the long term forecasts of benign inflation; a temporary decline in inflation caused by a precipitous drop in a commodity’s price, the consistent and long term movement in the ISM PMI indexes in expansion territory; capacity utilization returning to its long term average where business investment has traditionally increased by 8% , or perhaps some other “negative” data set. That kind of data has to be negative rather than positive, right? Even the government’s annual inflation numbers for 2014 showed a + 3.4% increase in food prices; a 2.4% increase in medical service costs, a 2.9% increase in shelter expenses, and a 4.8% increase in medical commodities. The BLS called the rise in food prices “a substantial increase” over the 1.1% rate for 2013. While I am not predicting here a return to $80+ crude, the price may have already bottomed and the disinflationary impact created by the 50%+ decline is consequently a temporary abnormality that will self correct with supply and demand moving back into balance. Consumer Price Index Summary While it is too early to know whether intermediate and long term rates have started to turn back up, the recent movement is certainly cautionary and resembles the lift off in interest rates that started in May 2013, when the ten year was at a 1.68% yield, and culminated in a rate spike to 3.04% for that note by year end. 7 to 30 Year Treasury Yields 2/2/15 to 2/13/15 Daily Treasury Yield Curve Rates When looking at that table, it is important to keep in mind that a ten year treasury yield of 2.00% is abnormally low by historical standards since 1962: (click to enlarge) 10-Year Treasury Constant Maturity Rate – FRED – St. Louis Fed And this brings me to my word of caution about utility stocks. A 3% dividend yield is not too hot using history as a guideline. To be justified, the investor will have to buy into most of the Bond Ghouls Japan Scenario unfolding in the U.S. rather than a gradual return to something close to normal inflation and GDP growth. Valuation: For me, valuation is the kicker. What S & P sector currently has the highest P.E.G. ratio? Back in the late 1990s, I would have said technology stocks without looking to verify the answer. I said utility stocks now and I took the time to verify that response. An investor can download the current E.P.S. estimates for the S & P 500 and the various sectors from S & P in the XLS format. I can not link the document here, but anyone interested can find it using the exact google search phrase “XLS S & P Dow Jones Indices”. It should be the first result. As of 2/12/15, the estimated forward 5 year estimated P.E.G. for the utility sector is a stunningly high 3.65, and this sector has traditionally been one of the slowest growing sectors. Technology is at a 1.27 P.E.G. The P/E based on estimated 2015 earnings is 17.12. The data given by the sponsor of XLU immediately set off alarm bells when I looked at it recently. In addition to the vulnerability of stock prices due to a rising interest rate environment, the sponsor calculated the forward P/E at 17.14, which is normally a non-GAAP ex-items number, a 7.23 multiple to cash flow, and a projected 3 to 5 year estimated E.P.S. growth rate of only 4.86%, or a similar P.E.G. to one calculated by S & P and mentioned above. The Vanguard Utilities ETF (NYSEARCA: VPU ) has another set of data that is even more concerning than the XLU valuation information: As of 1/31/15, this fund owned 78 stocks, with a P/E of 20.8 times and a 2% growth rate. Portfolio & Management Taking into consideration the possible or even probable rise in rates, the low starting yields for utility stock purchases now, the high P/E and abnormally high P.E.G. ratio, I am just saying be careful out there. I will be discussing in my next blog a reduction in my position in the Duff & Phelps Global Utility Income Fund Inc. (NYSE: DPG ), a closed end fund that has performed well for me since my purchases. I may not start writing that blog until Monday after taking the time to write this one in my usual stream of consciousness writing mode. CEFConnect Page for DPG According to Morningstar, the Utilities Select Sector ETF ( XLU ) had a 2014 total return based on price of 28.73%, much better than SPY, and was up YTD 2.33% through 1/31/15. The tide has turned with the recent rise in rates since the end of last month. The total return for XLU is now at -4.34% YTD through 2/12/15. Just as a reminder, I only have cash accounts and consequently do not short stocks. I do not borrow money to buy anything. I have never bought an option or a futures contract. I am not paid anything to write these SA Instablogs or SA articles or any of my almost 2000 blogs written since early October 2008, mostly very long ones, published at Stocks, Bonds & Politics . I do not own any of those short ETFs. I am currently substantially underweighted in the Utility sector.
New High Income Global Infrastructure ETF Fills A Void

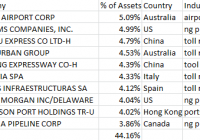
Backdated data suggests GHII could have a yield of 4.1%, vs a current yield of 2.06% for EMIF and 1.86% for PXR. GHII’s annual fees are almost half of EMIF and PXR. GHII’s has a more balanced portfolio with 20% of assets in the U.S. Many investors, myself included, use ETFs where investing in individual securities is difficult. A great example is the asset class of emerging market companies focusing on infrastructure. Infrastructure is broadly defined as those businesses involved in utilities, communications, transportation, port facilities, sewage, and water. Infrastructure is vital to the economic vitality and growth of any country. There is a new ETF in town that offers a bit of a twist on this theme. The Guggenheim High Yield Infrastructure ETF (NYSEARCA: GHII ) was launched last week and offers exposure to higher dividend income and a more diverse portfolio than its peers do. Guggenheim High Yield Infrastructure ETF is a replication of the S&P High Income Infrastructure Index, which are also components of the S&P Global BMI. A description from their website: The S&P High Income Infrastructure Index is designed to serve as a benchmark for yield-seeking equity investors looking for infrastructure exposure. The index is composed of the 50 highest-dividend-paying companies within the S&P Global BMI that operate in the energy, transportation, and utilities sectors. According to Oxford Economics and PwC, project global infrastructure spending will top nearly $78 trillion in 2014 and 2015 combined, with about 60% of that coming out of the Asia Pacific. GHII’s index allocates just over half its weight to utilities stocks, a third of its weight to the transportation/industrial sectors and 16% to energy names. The United States accounts for about 20% of initial geographical allocation while the rest of the fund is spread out over both developed and emerging markets. The next largest markets are Australia with 14% of allocation, China with 9%, and Spain and Italy with 8% each. However, many of these companies are multi-national and could have substantial assets in non-local market opportunities. It is important investors appreciate the portfolio of 50 stocks are rebalanced every 6 months. Due to this attribute, the composition, yield, and geographic diversity will change over time. Below is a review of the top 10 holdings of GHII, as listed on their website, listing the percentage of initial allocation, country of stock listing and the general industrial segment. The top 10 holdings represent almost half of the total allocation. There are two widely-held alternative global infrastructure ETFs: The iShares S&P Emerging Markets Infrastructure Index Fund (NASDAQ: EMIF ) and The PowerShares Emerging Markets Infrastructure ETF (NYSEARCA: PXR ). EMIF contains a higher percentage of utilities and infrastructure operators and PXR is heavily weighted to infrastructure construction. GHII exposure is 16% energy, 33% transportation and 51% utility vs a more balanced 15%, 45%, and 40%, respectively, for EMIF. PXR invests 61% in steel, construction firms and construction materials, and 90% of assets are invested in industrials and materials firms. GHII and EMIF are heavy to infrastructure operators while PXR is heavy to infrastructure builders. ETF Insight Comments posted on ETF.com: Newly launched GHII enters the global infrastructure space with a competitive fee and a strong emphasis on dividend yield. Like its peers, the fund invests in industries within the energy,transportation and utility sectors. GHII’s yield focus sets it apart from competitors; however, the fund does not just hold the dividend payers, it screens out all but 50 stocks with the highest dividend yield, and weights stocks by yield too. As such, we expect the fund to handily beat our benchmark and most-if not all-segment funds on yield, but not necessarily on total return. GHII does not screen for dividend sustainability, and like other yield-focused plays, may be adversely affected by rising interest rates. Still, assuming the fund can garner viable assets and liquidity, the fund will be an attractive take on the space for income-oriented investors. One of the main differences compared to other infrastructure ETFs is GHII’s focus on income. GHII’s backdating of performance shows an average yield of 4.15% on a 12-month basis, 4.68% on a 3-yr basis and 4.48% on a 5-yr basis. This compares quite favorable to its peers with 2.06% current yield for EMIF and 1.86% for PXR. On a performance basis, GHII has offered a better total return than the complete BMI Index. According to the Index website, a $10,000 investment in The S&P High Income Infrastructure Index in 2007 would be worth $17,500 while the total S&P BMI Index would have grown to $14,000. In addition, backdating the performance shows a potential substantial out performance than either EMIF or PDX. Below are two charts from S&P concerning its indexes: (click to enlarge) (click to enlarge) According to Morningstar, EMIF’s 1-yr total return is 6.36%, 3-yr total return is 2.81% and 5-yr total return is 5.51%. PXR has generated total returns of 1.59%, -0.52% and -0.57%, respectively. GHII charges 0.45% fees vs 0.75% for both EMIF and PXR. More information on GHII can be found at their website here and in their press release here [pdf]. The underlying S&P index factsheet is linked here . Investors should be aware of the impact of a rising or falling dollar on foreign stock ETFs. Usually, foreign stocks perform better in times of a falling U.S. Dollar than in times of a rising U.S. Dollar, and the trend since last May has been strength in the U.S. Dollar. While individual currencies may move higher or lower than the underlying trend in the USD Index, the impact on exchanging foreign share prices and dividend paid from foreign currencies to USD should not be overlooked. Based on just a 5% move in the USD either higher or lower, the yield could vary from 3.94% to 4.37%, everything else being equal. In addition, many foreign companies pay their dividend on an annual or semi-annual basis and the amount of the dividend can be more variable based on actual earnings. Income seeking, longer-term contrarian investors who believe the days of U.S. Dollar strength may be waning could be intrigued by the potential boost in the conversion of foreign cash dividends to U.S. Dollars during falling exchange rate trends. For investors looking for more stable international dividend exposure should review GHII. A combination of EMIF and GHII covers quite a bit of ground internationally with little overlap of positions. I have taken this avenue. Author’s Note: Please review disclosure in Author’s profile. Disclosure: The author is long GHII EMIF. (More…) The author wrote this article themselves, and it expresses their own opinions. The author is not receiving compensation for it (other than from Seeking Alpha). The author has no business relationship with any company whose stock is mentioned in this article.

The Oil Trade Update

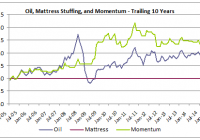
Like most risky asset classes, oil exhibits short-term momentum. Investors seeking short-term gains from timing a bounce in oil prices should understand this phenomenon, which could be reversing. After seven monthly losses for oil, momentum might finally have turned the corner, giving traders with a shorter-term horizon impetus to add positions. While evolving supply and demand factors impacting oil prices favor a longer-term value investing approach, a simple momentum heuristic could point to potential near-term gains. This is a re-purposed version of an earlier article that cautioned potential investors to take a long-term value approach to falling prices. As I have written previously, the performance of oil exhibits short-term momentum. What does that mean? On average, falling oil prices continue to fall in the short term. Conversely, rising oil prices continue to rise in the short term. Like I have done previously in articles about momentum’s impact on the returns stocks and bonds , I can demonstrate this phenomenon empirically. Understanding the power of short-term momentum can help Seeking Alpha readers more ably position oil-related exposures. Oil prices have been falling for several months, dragging down energy-related investments. With oil prices stabilizing and beginning to rebound, the negative trend from momentum could also be reversing. Imagine a world with just two asset classes – oil and your mattress. Knowing that oil exhibits short-term momentum, you invest in oil when it has produced a positive return over the trailing one month. If oil is falling, you stick your money in your mattress, earning zero. The cumulative return profile of oil, mattress savings, and a momentum strategy that toggles between oil and mattress stuffing based on which had outperformed for the trailing one month and holds that leg forward for one month is diagrammed below for the trailing ten-year period (see full results at the end of the article). Over the last ten years, if you had stuffed your money in the mattress, you would have of course earned zero. If you had purchased oil, this recent downturn would have taken you to a negative ten-year cumulative return. If you would have properly understood the momentum phenomenon, you would have more than doubled your money. (Source: Bloomberg WTI Crude) This simple heuristic to knowing when not to invest in oil based solely on trailing returns delivers tremendous outperformance. Even before the recent downdraft in oil prices, the oil/mattress momentum strategy outperformed a long-only oil strategy materially. Why? First, the countries, companies, and cartels that are major players in the global market are very large, and the forces that shape oil prices are slow-moving. Even absent the game theory inherent in supplying oil, reducing supply to the market takes time. Conversely, there is a lag effect from higher demand and prices manifesting into increased exploration via the drill bit. Secondly, short-term momentum is a powerful market anomaly present in many markets. (See Erb and Harvey (2006) on momentum impacts in commodity markets, or a litany of sourced articles I have written on the subject in other asset classes with performance proof). This does not mean that beaten-down energy stocks are a bad investment today, just that picking a short-term bottom in oil prices to generate short-term gains is a difficult proposition. If you are underweight energy stocks, then you should examine an increased allocation. As demonstrated pictorially in the chart below, buying energy stocks after a correction tends to generate very strong long-term performance. This graph shows the S&P Energy Index, replicated by the Energy Select Sector SPDR Fund (NYSEARCA: XLE ), over the trailing 25 years graphed against oil. (Source: Bloomberg, Standard and Poor’s) When I first wrote a version of this article in early December, short-term momentum suggested that oil prices and energy stocks could weaken further. Oil has fell an additional 32% over the next two months through the end of January. With oil again producing a negative return in January, the momentum strategy would again suggest that investors stay out of energy-related investments this month. My momentum strategy uses monthly calendar returns, in part because it is easier to find monthly return information historically. One-to-three month momentum with one to three month lookbacks have been shown to produce alpha across asset classes, markets, and time. Using a one-month lookback from today until mid-January and oil prices have risen by 13%. Perhaps this turnaround signals reversing momentum and further gains ahead. I have added to energy-related investments with an eye towards long-term value. Short-term momentum helped me to avoid the deepening correction. These investments have included a factor tilt towards low-cost energy focused exchange-traded funds. Given my traditional tilt towards low volatility investments (NYSEARCA: SPLV ), I was underexposed to energy pre-correction. I added broadly to closed-end high yield bonds funds, w hich were disproportionately negatively impacted by the oil drawdown . I have also added closed-end funds like Clearbridge American Energy MLP Fund (NYSE: CBA ), a pipeline focused MLP which was trading at nearly a ten percent discount to net asset value and generating a nearly eight percent yield at the time of purchase. The midstream sector is less exposed to commodity prices, and the selloff appeared to be overdone with investors selling energy-related funds indiscriminately early in the correction. A more speculative play was my add to Memorial Energy Production Partners (NASDAQ: MEMP ), an energy and production-related MLP that had strongly hedged several years of forward production as part of its business strategy, but suffered in the downturn like it was fully exposed to the commodity price drawdown. MEMP still offers nearly a 13% distribution rate even after the recent bounceback. Another long-term value play in the Energy space was my purchase of busted business development company, OHA Investment Corporation (NASDAQ: OHAI ). The company, formerly known as NGP Capital Resources is heavily exposed to the oil and gas industry with seventy percent of investments in those sectors. The company has recently brought in leading distressed debt manager Oak Hill Advisors to manage the fund. The company is trading at over a forty percent discount to net asset value. While I expect further impairments on its energy loans and a likely dividend cut, the combination of the deep discount, strong manager, inside management purchases, low leverage, and healthy liquidity all make a long-term rebound and strong forward risk-adjusted returns appear likely. Of my energy adds, this has been the worst performer thus far, but I believe downside is limited with the market capitalization trading roughly equal to the value of cash, Treasury bills, and non-Energy investments on the balance sheet. Do not be distracted by the potential for short-term losses and heightened volatility. Successful investing in oil and oil-related stocks is as simple as expanding your investment horizon. Even if you trade with a shorter-term focus, momentum could be reversing in oil given the positive trailing one-month return. Disclaimer: My articles may contain statements and projections that are forward-looking in nature, and therefore inherently subject to numerous risks, uncertainties and assumptions. While my articles focus on generating long-term risk-adjusted returns, investment decisions necessarily involve the risk of loss of principal. Individual investor circumstances vary significantly, and information gleaned from my articles should be applied to your own unique investment situation, objectives, risk tolerance, and investment horizon. Appendix on Oil/Mattress Momentum: (click to enlarge) Disclosure: The author is long XLE, OHAI, MEMP, CBA, SPLV. (More…) The author wrote this article themselves, and it expresses their own opinions. The author is not receiving compensation for it (other than from Seeking Alpha). The author has no business relationship with any company whose stock is mentioned in this article.