Tag Archives: earnings-center

Smarter Than Smart Beta?

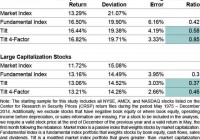
Summary Fundamental Indexation, one popular “smart beta” equity strategy, handsomely outperformed a market-weighted index during the 40 years to December 2014. There is a very pronounced tilt to value in Fundamental Indexation, which weights stocks according to accounting fundamentals rather than by market capitalization. We find that combining market price-based information with fundamental information in a quantitative multi-factor portfolio produces better risk-adjusted performance than either the market or fundamental index. Smarter than Smart Beta? In recent years, smart beta has entered the lexicon of the mutual fund industry and is used to describe certain quantitative investment strategies that aim to beat passive indexes. One of the most popular smart beta strategies is called fundamental indexation. We recently conducted a comprehensive examination of a fundamental indexation strategy using the last 40 years of data and compared this approach to that of two alternative quantitative approaches. The results from the study were revealing. Key findings are outlined below. Fundamentals and Value So what is fundamental indexation? Whereas a traditional passive index such as the Russell 1000 weights stocks by market capitalization, a fundamentals-based index weights stocks according to their accounting fundamentals. So for example, in a market-cap based system, if Apple accounts for 4% of the market cap of the Russell 1000 Index, then it will be assigned a 4% weight. Then, the manager of a fundamental index will increase or decrease Apple’s weight in his index depending on information drawn from Apple’s balance sheet, income statement and statement of cash flows relative to the same accounting information for the other Russell 1000 companies. Proponents of fundamental indexation argue that market-cap weighting will tend to inherently favor high-priced stocks (recall the effects on market-weighted indexes of the tech bubble of the late 1990s) and discriminate against stocks that might be temporarily undervalued. Indeed, the fundamental indexes we constructed in our study for both small cap and large cap stocks handily outperformed their benchmark market indexes during the 40-year period, with lower volatility than the indexes (see “Fundamental Index” in Exhibit 1 below). For this study we assigned index weights, tilting to high fundamentals-to-price stocks (e.g., high book value-to-price), based on the same four accounting factors typically used by fundamental indexers: book equity, along with five-year averages of revenues, operating income before depreciation, and dividends. When we decompose our fundamental indexes, not surprisingly we find a pronounced tilt to value compared to their market cap-oriented indexes, which (given the historical premium for investing in value stocks) helps to explain the excess returns. (click to enlarge) Listening to the Market So far, so good. Now let’s move on to our two alternative approaches, both of which incorporate not only fundamental information but also valuation- or price-based information from the market. In our mind, one weakness of relying exclusively on accounting fundamentals is that they’re stale information (i.e., reported with a lag time). Typically a few months out of date, they also ignore prices and expectations in the market (see Exhibit 2). For a specific example of what I’m talking about, consider the case of Lehman Brothers in the fall of 2008. Lehman started the fourth quarter of 2007 with about $20 billion of book value and, even on the eve of bankruptcy in the fall of 2008, still had close to $18 billion of book value. But by this time the firm’s stock price had collapsed as Lehman was consumed in the financial crisis. A smart beta strategy such as fundamental indexation would not only ignore information in the market price but, because it’s focused solely on the fundamental of book value, would actually signal to double down and buy more Lehman stock. (click to enlarge) So in constructing our two alternative portfolios, we start with the market index and then tilt towards stocks with high fundamental-to-price ratios. For the modified market index (“Tilt” in Exhibit 1), we start with the market index then make tilts using price-scaled information (i.e., fundamental divided by price) from the same four fundamentals that we used in the Fundamental Index. Note that the return and volatility figures for Tilt are very similar to those of Fundamental Index, but that the tracking error and information ratios (NYSE: IR ) are much improved, particularly in the case of small caps. For this study, we chose the IR to measure risk-adjusted portfolio performance (the formula is IR= (Portfolio return – Index return)/Tracking Error). Briefly, tracking error measures divergence from the market index, which by definition has a tracking error of zero (a lower tracking error is better). The IR essentially captures how intelligently different the portfolio’s return is relative to the index (the higher the IR, the better). One reason many portfolio managers and analysts look closely at tracking errors and IR comparisons is due to investor behavior-investors typically seek to beat a market index consistently (a skill that eludes most active fund managers), but get scared if returns swing around wildly and differ dramatically from those of the index. Finally, we studied a four-factor model (“Tilt 4-Factor” in Exhibit 1) that incorporates information from the following four firm characteristics: value, profitability, asset growth, and momentum (for a quick review of factor-based investing, please see my most recent column: ” The Factor-Based Story behind Successful Growth Funds “). Note that this approach combines three so-called slow-moving factors (value, or book equity-to-price; profitability; and asset growth, to which we assign a negative tilt) derived from financial statements with the fast-moving factor of momentum, which reflects price changes for stocks over trailing 12-month periods. We find that this approach, with better factor diversification (e.g., signals from momentum as well as value), produces the best risk-adjusted performance of all, with slightly better returns and lower volatility than for the Fundamental Index and dramatically higher information ratios-twice as high in the case of the small cap stock portfolio. To us, this speaks of the allure of quantitative multi-factor investing, wherein a portfolio manager can combine multiple quantitative insights and improve on a market-based index over extended investment periods. If you would like to learn more about the research I have described in this column, I invite you to read our original study: ” Decomposing Fundamental Indexation .” Conclusion We decomposed fundamental indexation, a leading smart beta investing strategy, during a 40-year period. We find that this modified index has a strong value bent and does indeed outperform the market index by several measurements. But we also find that two alternative portfolio strategies that incorporate market price information generate even stronger risk-adjusted performance results. Disclosure: I/we have no positions in any stocks mentioned, and no plans to initiate any positions within the next 72 hours. (More…) I wrote this article myself, and it expresses my own opinions. I am not receiving compensation for it. I have no business relationship with any company whose stock is mentioned in this article.

5 Buy-Ranked Small-Cap Blend Mutual Funds

Fund holdings, ETF investing “}); $$(‘#article_top_info .info_content div’)[0].insert({bottom: $(‘mover’)}); } $(‘article_top_info’).addClassName(test_version); } SeekingAlpha.Initializer.onDOMLoad(function(){ setEvents();}); Small-cap blend funds are a type of equity mutual fund which holds in its portfolio a mix of value and growth stocks, where the market capitalization of the stocks are generally lower than $2 billion. Blend funds are also known as “hybrid funds”. Blend funds aim for value appreciation by capital gains. It owes its origin to a graphical representation of a fund’s equity style box. In addition to diversification, blend funds are great picks for investors looking for a mix of growth and value investment. Meanwhile, small-cap funds are a good choice for investors seeking diversification across different sectors and companies. Investors with a high risk appetite should invest in these funds. Below we will share with you 5 buy-ranked small-cap blend mutual funds . Each has earned either a Zacks Mutual Fund Rank #1 (Strong Buy) or a Zacks Mutual Fund Rank #2 (Buy) as we expect these mutual funds to outperform their peers in the future. QS Batterymarch U.S. Small Capitalization Equity Portfolio (MUTF: LGSCX ) invests a large chunk of its assets in securities of small cap companies. LGSCX primarily invests in domestic companies or those which operate predominantly in the U.S. LGSCX may also invest in non-US firms through ADRs. The QS Batterymarch U.S. Small Capitalization Equity Portfolio fund has a 3-year annualized return of 22.3%. Stephen A. Lanzendorf is the fund manager and has managed LGSCX since 2006. American Century Small Company Fund (MUTF: ASQIX ) seeks long-term capital appreciation. ASQIX invests a major portion of its assets in common stocks of small sized companies. ASQIX invests in companies having market capitalizations similar to those included in the Russell 2000 Index. The American Century Small Company Fund has a 3-year annualized return of 21.7%. ASQIX has an expense ratio of 0.87% compared to a category average of 1.23%. Fidelity Advisor Small Cap Fund A (MUTF: FSCDX ) invests a lion’s share of its assets in companies having market capitalizations within the range of either the Russell 2000 Index or the S&P SmallCap 600 Index. FSCDX uses “blend” strategy to invest in common stocks of companies. The Fidelity Advisor Small Cap Fund A has a 3-year annualized return of 22.6%. As of February 2015, FSCDX held 107 issues, with 7.85% of its total assets invested in Russell 2000 Index Mini TIC. Principal SmallCap S&P 600 Index Fund Retirement (MUTF: PSSMX ) seeks capital appreciation over the long run. PSSMX invests a majority of its assets in firms listed in the Standard & Poor’s SmallCap 600 Index. PSSMX also invests in index futures and equity ETFs in order to reduce tracking error by gaining exposure to the index. The Principal SmallCap S&P 600 Index Fund Retirement has a 3-year annualized return of 20.7%. Thomas L. Kruchten is the fund manager and has managed PSSMX since 2011. TIAA-CREF Small-Cap Equity Retail Fund (MUTF: TCSEX ) invests heavily in domestic small cap companies having market capitalizations identical to those included in the Russell 2000 Index. TCSEX primarily invests in small sized companies across different sectors. The TIAA-CREF Small-Cap Equity Retail Fund has a 3-year annualized return of 21.4%. TCSEX has an expense ratio of 0.78% compared to a category average of 1.23%. Original Post Share this article with a colleague

VTI: Who Cares About The Middle Class?

Summary New legislation that may curtail unpaid overtime has been introduced. The P/E ratio of the market is at moderately high levels but the E (earnings) relative to GDP is extremely high. A shift to higher income for labor would be a negative short term catalyst but may be necessary for long term economic health. I’m preparing for the shift by buying less broad/total market funds and more equity REITs. While the turmoil in Greece has been capturing the headlines, there are other issues that may hit much closer to home. I’ve been a fan of indexing the market and riding out the bumps through dollar cost averaging. I believe American investors can be served well by using a diversified index like the Vanguard Total Stock Market ETF (NYSEARCA: VTI ). Even as an analyst, I combine VTI with equity REIT ETFs as the major source of value in my portfolio. I believe in using the index as the main holding and attempting to build around it rather than attempting to individually pick every stock. While VTI is delivering an excellent expense ratio (.05) and excellent diversification (3827 holdings), it is still subject to market risk. I am concerned that we may be nearing a market top for the broad equity market and I am shifting my portfolio to a heavier concentration of equity REITs. Because I believe shorting the market is the game of fools, I would never recommend it. However, I do think the risk/return proposition favors equity REITs. The Middle Class There is a common refrain about the disappearing middle class. I must admit that I do believe over the next decade we may see a further increase in the gap between the “Haves” and the “Have Nots”. In my opinion, the market is far less attractive without consumers to buy the crap on the shelves. Background It helps to remember that the market can still be viewed by running numbers on the S&P 500 which makes up a very substantial portion of VTI. The following chart, built with data from multpl.com, shows the P/E ratios for the S&P 500 over a very long time frame. (click to enlarge) You might notice that we are currently right around the trend, but that is a very serious problem when we consider that earnings are exceptionally high as seen in the chart below: (click to enlarge) Corporate profits after taxes are hitting staggering values by historical measures. I believe a major factor in the high corporate profits is the introduction of more automation and a lack of intense competition in some sectors. One sign for weaker competition is buybacks. When companies are spending their cash on repurchasing shares there is an improvement in the P/E ratio and there is a fundamental increase in the shareholders ownership of the assets, but there is no increase in productivity capacity. A lack of new capacity leads to weaker competition which protects profit margins. If you need to see what high capacity and intense competition looks like, simply research companies in the mining sector. Earnings, ore prices, and share prices have fallen dramatically due to the intense competition. If corporate profits after tax were to revert to a more historically normal level as a percentage of GDP without enormous growth in GDP, it would lead to much lower earnings. Those lower earnings in turn would lead to lower share prices unless the P/E multiples increased significantly. The Headwind for Earnings The White House recently released a fact sheet on some proposed new legislation that would significantly expand the number of workers eligible for overtime pay. Nearly five million workers would be covered and this could set up quite a bit of political sparring. If nothing else changed and the companies simply paid the overtime that is currently avoided through “salaried” compensation, the simple result would be increases in labor expenses and compressed profit margins. At the same time, I would expect increased levels of sales as more money would go to middle class and lower class workers with a high propensity to consume . In short, the money would go into their pockets and then into the cash register at another establishment. Companies Won’t Agree I expect to see some fairly substantial lobbying efforts spend to fight or minimize this bill because the cost of purchasing congressmen and senators is cheaper than the cost of paying overtime to low-wage salaried employees. Was that too blunt? I’d rather get the point across clearly. The legislation is designed to raise the level of salary required to keep an employee exempt. The reason it is important for the long term health of the economy is that the current level is at less than $24,000 per year. By labeling employees as exempt, companies are able to work the employees for overtime that can drive their effective wage rate below minimum wage laws while claiming that the employees are “managers”. To the extent that this encourages companies to simply hire more employees for regular schedules, the change could be positive by improving employment rates and revitalizing a struggling middle class. However, it wouldn’t happen without pain. While the sales would be expected to increase, the weaker margins would compress earnings and I would expect share prices to fall. For VTI, that could mean share prices dropping as low as $90 in a bearish scenario (about a 15% pull back). Long Term I believe the long term implications would be very positive as it would improve employment prospects for many struggling families so a significant pull back would become a great buying opportunity. Without growth in the middle class, I think the growth in EPS from repurchasing shares may become unsustainable because earnings still depend on sales and sales still require consumers that can afford the products. In the short term, growth by repurchasing sales is fine. Over the long term, it fails to provide new productive (physical) assets that generate the wealth that we consume as humans. Seeing an end to unpaid overtime through the guise of “salaried” work would be a short term negative catalyst for stock prices, but it may be necessary for a healthy economy. I’m preparing by shifting more of my purchases into the REIT sector where I expect strong income to translate into higher average rents. I’m reducing my purchases of the broad U.S. market, to the acquisitions made by my dollar cost averaging in an automatic retirement account. How will you prepare? Disclosure: I am/we are long VTI. (More…) I wrote this article myself, and it expresses my own opinions. I am not receiving compensation for it (other than from Seeking Alpha). I have no business relationship with any company whose stock is mentioned in this article. Additional disclosure: Information in this article represents the opinion of the analyst. All statements are represented as opinions, rather than facts, and should not be construed as advice to buy or sell a security. Ratings of “outperform” and “underperform” reflect the analyst’s estimation of a divergence between the market value for a security and the price that would be appropriate given the potential for risks and returns relative to other securities. The analyst does not know your particular objectives for returns or constraints upon investing. All investors are encouraged to do their own research before making any investment decision. Information is regularly obtained from Yahoo Finance, Google Finance, and SEC Database. If Yahoo, Google, or the SEC database contained faulty or old information it could be incorporated into my analysis.