Tag Archives: earnings-center

USAGX: An Underwhelming Fund Covering An Ugly Sector

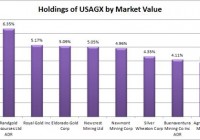
Summary USAGX offers investors a 1.24% expense ratio to go with a very undesirable batch of companies. The fund holds only 55 companies so investors seeking to diversify can get enough diversification without the mutual fund. The mining industry (including precious metals) is currently in a terribly bearish cycle because of the industry dynamics. Individual companies are choosing to expand production to lower average cost per unit. Expanded production is driving global supply higher and prices lower. One of my picks for least attractive investment is the USAA Precious Metals and Minerals Fund No Load (MUTF: USAGX ). This isn’t a slam on USAA; I believe their banking services and insurance products are excellent. Unfortunately, this mutual fund doesn’t resemble the rest of the sponsor’s company. Terrible Sector The first issue with USAGX is that it is simply positioned in a terrible sector. The mutual fund is investing heavily in mining companies and precious metals which has been a very ugly sector for years. To be fair, I have one mining company in my portfolio and it is a trading investment, not a long term holding. The mutual fund suffers from a few things but one major factor impacting returns has been that mining sector has been terrible. I regularly tell investors to ensure their holdings are adequately diversified, but I can’t bring that same argument to the mining sector. The problem with the mining sector is that the status quo is destroying the industry. Major mining companies are working desperately to expand production as prices crash seeking safety through having lower average costs of production than their competitors. The primary method for reducing their costs is to constantly drive their volume upwards which allows the fixed costs to be spread over a larger volume of production. In a vacuum, that strategy would make perfect sense. Under perfect competition we assume that companies are unable to produce enough of any commodity or product to influence the market price. In reality, we see that this competitive cycle has resulted in too much capacity being built and more being on the way. The only way to get a real broad based recovery for the entire sector, the kind of recovery that would be great for diversified investors, would be for the industry to see dramatically lower levels of competition. Since the biggest companies have been very clear about their intentions to continue driving up capacity rather than worry about the state of the industry, the most likely scenario for capacity to go offline is for smaller firms to fail. Holding a diversified portfolio means holding companies that will go bankrupt as well those that will survive. Diversified with Cost To be fair, it is possible that the investments within USAGX will be picked carefully to avoid holding the ones that will go bankrupt. That is a viable argument, for using an actively managed fund over a passive fund. However, there isn’t a great deal of turnover in the portfolio. The last reported statistic for portfolio turnover showed only 10%. Despite the relatively low turnover, the expense ratio is a mind blowing 1.24%. This is remarkably better than the category average of 1.5%, but this is really a sign to investors that creating a mutual fund for this sector may be a profitable investment. Except it is not that Diversified Despite the high expense ratio, the mutual fund isn’t actually that diversified even within the mining sector. The fund holds only 55 companies and is focused on precious metals rather than being spread across all metals. Easier to replicate For investors that want exposure to the holdings, they may want to seriously consider buying the individual companies or using one of the services that will assist the investor in investing in their own customized fund. For instance, Motif offers investors the ability to create their own custom investment and buy shares in it. Motif would limit those investors to 30 stocks in their customized investment, but the difference from a diversification standpoint between 30 stocks in one sector and 55 stocks in the same sector is not that large. I like broad market ETFs that investing in several segments of the economy for diversification. I also like expense ratios under .10%. If an investor is willing to eat substantial annual costs, they would be better off dealing with the trading fees than paying the expense ratios to use mutual funds for this sector. Holdings The chart below shows the top ten holdings of USAGX. (click to enlarge) Precisely as described, the holdings are focused on mining precious metals. I have no problem with the individual holdings as companies, but I find the industry very unattractive because excessive competition is driving down prices, which in turn is hurting margins, and each individual company is aiming to fix the problem for themselves by creating more the commodity. When the behaviors are looked at individually, they make perfect sense. When they are seen collectively, this is the tragedy of the commons playing out on a global level. Conclusion The only thing I can find to like about the mutual fund is the lack of a load fee. Overall, I see inefficient segment of the market where the mutual funds are offering investors terrible returns and sponsors high income from expense ratios. Investors confident that they should invest in this sector would be better off doing the due diligence on each company they want to buy rather than buying a group of companies that are rapidly working to destroy each other and accidentally destroying themselves in the process. Disclosure: I/we have no positions in any stocks mentioned, and no plans to initiate any positions within the next 72 hours. (More…) I wrote this article myself, and it expresses my own opinions. I am not receiving compensation for it (other than from Seeking Alpha). I have no business relationship with any company whose stock is mentioned in this article. Additional disclosure: Information in this article represents the opinion of the analyst. All statements are represented as opinions, rather than facts, and should not be construed as advice to buy or sell a security. Ratings of “outperform” and “underperform” reflect the analyst’s estimation of a divergence between the market value for a security and the price that would be appropriate given the potential for risks and returns relative to other securities. The analyst does not know your particular objectives for returns or constraints upon investing. All investors are encouraged to do their own research before making any investment decision. Information is regularly obtained from Yahoo Finance, Google Finance, and SEC Database. If Yahoo, Google, or the SEC database contained faulty or old information it could be incorporated into my analysis.

Long/Short Hedge Fund Factors: Low-Cost Downside Protection?

By Wesley R. Gray, Ph.D. The holy grail of financial markets is finding strategies that have misaligned risk and reward characteristics. In the traditional view, investors try to do the following: Identify strategies that have high returns , then… find ways to get the exposure with the lowest risk possible . However, there is another angle on this concept… Identify strategies that have great risk-management benefits , then… find ways to get the exposure at the lowest cost possible . For example, you might buy out of the money puts, which in a crisis will finish in the money and generate insurance-like returns. But puts might be expensive… What if you could identify an asset where the cost of this insurance is de minimus or – better yet – you get paid to own the insurance? That is, if you commit capital, you will, in expectation, generate positive returns over time-and get an insurance benefit. This would be the holy grail! This line of thought is a bit unorthodox, but may lead to creative portfolio solutions. An applied example: The US Treasury Bond. First, let’s frame the question through the typical lens: focus on expected returns first, volatility second. Many consider the US Treasury Bond to have low expected return, but high potential risk. The low expected return is due to low yields, and the high potential risk is associated with the fact that if we were to move down the “banana republic” path, long bonds would arguably get crushed. Everyone seems to know this. Conclusion: Bad investment. Next, let’s frame the question through a different lens: focus on risk-management benefits first, expected returns second. When we look at the US Treasury Bond as a risk-management instrument, we identify some amazing historical benefits that are distinct from its expected return characteristics. The results below highlight the top 30 drawdowns in the S&P 500 Total Return Index from 1927 to 2013. Next to the S&P 500 return is the corresponding total return on the 10-Year (LTR) over the same drawdown period: (click to enlarge) The results are hypothetical results and are NOT an indicator of future results and do NOT represent returns that any investor actually attained. Indexes are unmanaged, do not reflect management or trading fees, and one cannot invest directly in an index. Additional information regarding the construction of these results is available upon request. Leaving aside (for a moment) questions about long-run returns, the US Treasury Bond suddenly looks more like an insurance contract, and less like a traditional investment. Again, with a traditional investment, we would tend to focus first on expected return and standard deviation. Conclusion: We’ve potentially identified an insurance contract that pays us to hold it. Moving from US Treasury Bonds to Hedge Fund Factors The example above is not meant to be a pitch for or against US Treasury Bonds. The analysis is merely meant to highlight how framing the investment decision can potentially lead to different conclusions. In our quest to find additional low-cost-or free-portfolio insurance assets, we started playing with common “factor” returns. As insurance contracts, do these exhibit characteristics similar to what we saw before with respect to Treasury bonds? The results were surprising… We examine 3 common hedge fund “factor” portfolios alongside the S&P 500 Index: SP 500 = SP 500 Total Return Index HML = The average of 2 value portfolios (small and large) minus the average return of two growth portfolios (again, small and large) MOM = The average of 2 high return portfolios (small and large) minus the average return of two low return portfolios (small and large) QMJ = The average of 2 high-quality portfolios (small and large) minus the average return of two low-quality portfolios (small and large) Results are gross of management fees and transaction costs. All returns are total returns and include the reinvestment of distributions (e.g., dividends). Data are from AQR and Ken French . Summary Statistics: Here are the returns (1/1/1963-12/31/2014): (click to enlarge) The results are hypothetical results and are NOT an indicator of future results and do NOT represent returns that any investor actually attained. Indexes are unmanaged, do not reflect management or trading fees, and one cannot invest directly in an index. Additional information regarding the construction of these results is available upon request. Conclusion: You got paid to hold the hedge fund factors over the long-term. Insurance Benefit Analysis: In the context of a traditional asset pricing model, such as the Capital Asset Pricing Model (CAPM), an asset that actually delivers returns when the rest of the world is blowing up (i.e., negative beta during treacherous times), should have a negative expected return because of the diversification benefits. For example, the CAPM says the expected return of an asset equals the risk-free rate plus beta times the expected excess return of the market portfolio: r a = r rf + B a (r m -r rf ) In this equation, if beta is negative, then the asset could earn negative returns and the investor should be happy owning it. For example, let’s say rf=3%, Rm-rf= 4%, and B=-1. The expected return = -1%. Hence, under CAPM, you have to pay for an insurance contract. Yet as the analysis above highlights, all of these L/S factors have positive carry. In a traditional asset pricing framework, these assets should not act like portfolio insurance. But how do these strategies perform as insurance contracts? When we look at the worst 30 drawdowns on the SP 500 since 1963 we see a very interesting pattern – Factors tend to rip higher during crisis. In other words, hedge fund factors look and feel like insurance contracts that pay off during chaos. (click to enlarge) The results are hypothetical results and are NOT an indicator of future results and do NOT represent returns that any investor actually attained. Indexes are unmanaged, do not reflect management or trading fees, and one cannot invest directly in an index. Additional information regarding the construction of these results is available upon request. Conclusion: Hedge fund factors are VERY interesting in a portfolio context. Original Post

Inside iShares’ 2 Factor-Based International ETFs

Rolling out a global version of a successful domestic fund is the latest trend. Many issuers first launched a unique-themed product on the U.S. economy, and then witnessing its growing acceptance and sensing the need of the hour, brought out its international edition. iShares, one of the most sought after ETF sponsors in the world, also follows this strategy. Back in 2013, the issuer had launched the iShares MSCI USA Size Factor ETF (NYSEARCA: SIZE ) and the iShares MSCI USA Value Factor ETF (NYSEARCA: VLUE ) in the backdrop of the U.S. market. While SIZE has generated over $236 million in assets, VLUE has garnered even more, with $712.5 million so far. Now, the sponsor has initiated two ETFs with the same investing theme as that of SIZE and VLUE on the international environment. Let’s take a look at the two ETFs in detail: The newly launched ETF looks to track the performance of the MSCI World ex USA Risk Weighted Index. The fund currently holds 842 stocks with a lower risk outlook from the 17 developed markets. Though the fund takes large- and mid-capitalization stocks into account, stocks with comparatively lower market capitalization also get preference. With the surge of policy easing in the developed economies, international investing has become extremely popular this year. This was fueled up by the QE launch by the ECB and rock-bottom interest rate levels in the eurozone. The Japanese market also maintained the winning momentum on a stepped-up stimulus measure. However, one should note that relatively small-cap stocks better reflect the strength of an economy than larger ones. Large-cap stocks normally have a higher international presence and are affected by global events. On the other hand, small-cap stocks are highly volatile. Thus, a portfolio with smaller-cap stocks but lower realized volatility, like ISZE, can be an intriguing bet on the developed economy right now. The fund has a tilt toward Japan (19.73%), Canada (13.13%) and the U.K. (11.81%). Each of the other countries has less than 9.27% allocation. Sector-wise, Financials dominates the fund with 27% allocation, while Industrials (18.23%), Consumer Discretionary (13.02%) and Consumer Staples (9.94%) occupy the next three spots. The fund is low on Telecom (4.57%) and Information Technology (3.90%). It has very low company-specific concentration risk, with no single stock occupying more than 0.45% of the total. The fund charges 30 basis points as fees. Competition: The newly launched product is likely to face competition from quite a number of funds prevalent in the global equities space. Among them, ETFs with low risk exposure, including the PowerShares S&P International Developed Low Volatility Portfolio ETF (NYSEARCA: IDLV ), deserve a mention. Overall, the FlexShares Morningstar Developed Markets ex-US Factor Tilt Index ETF (NYSEARCA: TLTD ) and the PowerShares FTSE RAFI Developed Markets ex-U.S. Portfolio ETF (NYSEARCA: PXF ) can be considered as potential competitors. iShares MSCI International Developed Factor ETF (NYSEARCA: IVLU ) in Focus This ETF looks to focus on value in the broad developed economic stock market, tracking the MSCI World ex-USA Enhanced Value Index for its exposure. The fund holds 265 stocks in its basket and charges investors 30 basis points a year in fees. IVLU will focus on large- and mid-cap stocks and reweight firms based on several valuation metrics. These include price-to-book value, price-to-forward earnings and enterprise value-to-cash flow from operations. Though the developed economies have hemmed the investing theme so far in 2015, the path is not free of odds. Occasional threats including the nagging “Grexit” worries, the possibility of the Fed rate hike sometime later in 2015 and the consequent strength in the greenback, plus overvaluation concerns which keep bothering these markets. Thus, a keen attention on the value factor is warranted for edgy investors, and IVLU could do justice to them. In terms of exposure, the basket results in a big chunk of assets going to Financials (26.64%), followed by Industrials (12.52%) and Consumer Discretionary (12.08%). Healthcare (11%) and Consumer Staples (10.47%) take the next two spots. The fund is heavy on Japan (39.04%) followed by the U.K. (15.69%) and France (12.75%). Its holdings are a bit concentrated as compared to ISZE, as Sanofi (NYSE: SNY ) (4.46%), Toyota Motor (NYSE: TM ) (2.97%) and Teva Pharma (NYSE: TEVA ) (2.80%) combine to take up roughly 10.23% of the assets. Competition: The list of competitors is moderately crowded, as there are dozens of funds that focus on value for their exposure. The Schwab Fundamental International Large Company Index ETF (NYSEARCA: FNDF ), the FlexShares International Quality Dividend Dynamic Index ETF (NYSEARCA: IQDY ) and the ValueShares International Quantitative Value ETF (BATS: IVAL ) are some of the ETFs which could pose as threats to this newbie. Original Post