Tag Archives: earnings-center

The Philosophy Of Value Investing – Reject ‘New Paradigm’ Thinking

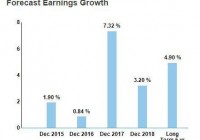
By David Foulke Every few years, people start to question whether value investing is dead. A recent Google search along these lines generated 3.1 million results: Likewise, people sometimes question whether the size effect is permanently going away. For instance, during the dotcom craze in the late 90s, large-cap growth investors made small-cap value investors look foolish. People jumped on the bandwagon, and embraced the “new paradigm” for investing. In “New Paradigm or Same Old Hype in Equity Investing?” Chan, Karceski, and Lakonishok (a copy is here ) examine equity returns across the growth/value and large-cap/small-cap spectrum during this era. I went ahead and cherry-picked some key data that illustrates the big picture trends explored by the authors. In the academic world, market returns during the 1970s and particularly in the 1980s were fertile grounds for researchers studying the cross-section of market returns, and variables that explained them. For instance, as can be seen from the panel below (from the paper, as are the other data below), during the 80s, value stocks earned more across the board than growth stocks, and small-cap value stocks beat small-cap growth stocks by 9% per year. The results are hypothetical results and are NOT an indicator of future results and do NOT represent returns that any investor actually attained. Indexes are unmanaged, do not reflect management or trading fees, and one cannot invest directly in an index. Additional information regarding the construction of these results is available upon request. This 1980s sample period was influential in the establishment of the “size anomaly” and the “value premium.” The evidence seemed clear – you should go forth and buy small-cap value stocks. But then something strange happened – Both of these anomalies seemed to show elements of reversal! 1. First, large-cap began to outperform. Note below how from 1984 through 1998, large cap beats small cap: The results are hypothetical results and are NOT an indicator of future results and do NOT represent returns that any investor actually attained. Indexes are unmanaged, do not reflect management or trading fees, and one cannot invest directly in an index. Additional information regarding the construction of these results is available upon request. And the large-cap trend only accelerated in the late 90s: The results are hypothetical results and are NOT an indicator of future results and do NOT represent returns that any investor actually attained. Indexes are unmanaged, do not reflect management or trading fees, and one cannot invest directly in an index. Additional information regarding the construction of these results is available upon request. The results are hypothetical results and are NOT an indicator of future results and do NOT represent returns that any investor actually attained. Indexes are unmanaged, do not reflect management or trading fees, and one cannot invest directly in an index. Additional information regarding the construction of these results is available upon request. 2. Second, growth also seemed to outperform value, particularly for large-caps. From 1990-1998, large-cap growth beat large-cap value: And again, as with the large-cap outperformance above in #1, by the late 90s the trend in growth also appeared to accelerate: The results are hypothetical results and are NOT an indicator of future results and do NOT represent returns that any investor actually attained. Indexes are unmanaged, do not reflect management or trading fees, and one cannot invest directly in an index. Additional information regarding the construction of these results is available upon request. Indeed, in general, growth began to look like the better overall bet than value. Based on value weightings, growth stocks beat value stocks by 1.1% from 1990-1998 (although small and mid cap value still beat growth over the period). Particularly in the late 90s, large-cap growth just hammered small-cap value. In 1998, for example, large cap growth earned 41%, while small cap value earned -1.2% . Value investors began to look like idiots. During this period, even the king of value investors – Warren Buffett – began to feel the pain. In their paper, “Buffett’s Alpha,” (a copy is here ) Frazzini et al. observe that from June 30, 1998 to February 29, 2000, Berkshire Hathaway (NYSE: BRK.A ) (NYSE: BRK.B ) lost 44% of its value while the overall stock market gained 32%. Thus, over this ~1.5 year period, Warren Buffett underperformed the market by an astonishing 76% . At the tail end of this stretch, Barron’s published a piece entitled, “What’s Wrong, Warren?” From the article: After more than 30 years of unrivaled investment success, Warren Buffett may be losing his magic touch. Huh? What was going on here? Was Warren Buffett no longer a guru, was value investing dead, and had the small-cap premium disappeared forever? Some seemed to think so. Yet, if this were the case, how could you explain why these anomalies would do a 180 degree turn, and perform in a way that was the opposite of how they had performed previously? The paper examines three potential explanations for why this could be the case: Rational Asset Pricing Under this view, the outperformance of large-cap growth was driven by a series of unexpected positive shocks for large caps, and negative shocks for small caps, perhaps due to new technology, or investor expectations. If this were true, then the performance edge of small-cap value should reappear in the future. New Paradigm Popularized during the dotcom bubble, this view argues that technology and the dynamics of large companies have altered the investing landscape. Technology will allow huge long-run returns, with high growth rates persisting in the future, and large-caps have sustainable advantages based on their scale and international presence. Therefore, the old paradigm, in which firms were priced based on historical returns, no longer applies, and new valuations might be low given the new high expected growth rates under these new-paradigm conditions. If this is true, then small-cap value may continue to lag large-cap growth for a long time. Behavioral/Institutional This view argues that investors overreacted to the growth potential of technological innovation, and prices became disconnected from underlying fundamentals. Additionally, as markets continued to march higher, and large cap growth continued to outperform, the trend was self-reinforcing. If this view is right, then small-cap value will in the future exhibit return patterns consistent with its historical performance. We can test these explanations. Did large-caps experience excess profitability and small-caps experience depressed profitability? If this were true, that would support the rational pricing and new paradigm interpretations. If we failed to see this evidence, that might support the behavioral interpretation. So what does the evidence say? The authors examined performance data based on four accounting metrics: net sales revenue, operating income before depreciation, income, and cash dividends. We’re going focus on sales only since, as the authors point out, this data has no negative values, and is “smoother” (although you can read the paper to confirm that the other accounting metrics exhibited similar characteristics). The authors examined the price-to-sales ratio of the various asset classes and found something surprising: The results are hypothetical results and are NOT an indicator of future results and do NOT represent returns that any investor actually attained. Indexes are unmanaged, do not reflect management or trading fees, and one cannot invest directly in an index. Additional information regarding the construction of these results is available upon request. Note the extreme multiple expansion for price-to-sales that occurred for large-cap growth from 1997 through 1999. This expansion was obviously not duplicated by the other asset classes. Yet was this expanded multiple justified by the fundamentals? No. Note below how 1996-98 sales growth for large-cap growth was nothing special at 6%. In fact, growth badly lagged the 29 year average for large-cap sales growth of 10.3%. The results are hypothetical results and are NOT an indicator of future results and do NOT represent returns that any investor actually attained. Indexes are unmanaged, do not reflect management or trading fees, and one cannot invest directly in an index. Additional information regarding the construction of these results is available upon request. Meanwhile, sales growth for small-cap and mid-cap showed no particular weakness; in fact, small-cap sales growth from 96-98 was 12.7%, versus its long term (70-98) average of 8.1% – much stronger than historically! While we have only reviewed price-to-sales versus sales growth in detail here, again, the other profitability metrics reviewed in the paper are consistent with these observations. We therefore have a reasonable basis for rejecting the rational asset pricing argument, since we observed no unexpected fundamental shocks. Sales growth trends actually showed the opposite: it was weak for large-cap growth, and strong for small-cap value. Similarly, we can (mostly) reject the new paradigm argument, since we weren’t able to identify any emerging trends in sales growth that would justify higher valuations. It’s possible that these dramatically higher growth rates would show up farther in the future, but again, you would expect to see at least some evidence that this was occurring. Accordingly, it seems reasonable to embrace the third argument: behavioral/institutional. That is to say, the very high valuations of large-cap growth became disconnected from any reasonable assessment of future growth prospects, and this was driven by human bias, as investors overreacted to new technology and wild extrapolations of internet growth, and they chased anticipated returns. Taking a Step Back This observation is not especially revolutionary, in hindsight. By now, it’s obvious to everyone that during the dotcom years investors were caught up in “irrational exuberance” and bid up large-cap growth stocks to unsustainable highs. Yet it is still remarkable to see the actual fundamental data laid out so starkly and juxtaposed with equity prices. One observation that emerges from this analysis is how broader trends and market distortions can cause certain historical patterns and relationships, such as the size anomaly the value premium, to break down. Yet, once these behaviorally-driven market trends recede, and internet fever subsides, it seems reasonable to think longer-term value and small-cap effect will take hold once again. Of course, during this period in the 90s, people began to question value and size effects. As was demonstrated, Warren Buffett lagged the market by 76%! And people questioned him and his methods. Now that is the kind underperformance that can give you plenty of cover to argue that Buffett has lost his touch, that value investing is dead, and that only suckers believe in the size anomaly. Yet we have a long history of returns that gives us confidence that value and size effects are persistent. So we should be realistic and recognize too that they are not consistent. That is, there are prolonged periods, such as this stretch in the late 90s, when large-cap growth looks like the smart way to bet going forward. So when you see a broad reversal, say when large-cap growth has a stretch of outperformance, don’t be fooled. Consider that it’s pretty likely that you are getting fooled by “new paradigm” thinking that prevailed in the 90s. Original Post

Book Review: Quantitative Value

Wesley Gray, manager of the ValueShares US Quantitative Value ETF (BATS: QVAL ), may very well be the most interesting quant you’ll ever meet. Granted, the word “quant” brings to mind an old man in a white lab coat stooped over reams of data, but hear me out. Before getting his PhD in finance from the University of Chicago, Gray did four years of service as an active-duty U.S. Marine Corps ground intelligence officer in Iraq and other posts throughout Asia. Quantitative Value isn’t even his first book. That distinction goes to Embedded: A Marine Corps Adviser Inside the Iraqi Army . It’s hard to imagine the average fund manager crawling through the muck and gathering intelligence in Iraqi Arabic. But that is Dr. Gray, and his work is far from average. Quantitative Value , co-written by Gray and Tobias Carlisle, is a solid piece of research that combines the successful value investing framework of Benjamin Graham and Warren Buffett with the analytical rigor seen in Jim O’Shaughnessy’s What Works on Wall Street and Joel Greenblatt ‘s The Little Book that Beats the Market . In fact, Gray and Carlisle write extensively about Greenblatt’s “Magic Formula” and much of the book is an attempt to build the proverbial better mousetrap. We’ll take a look at some of Gray and Carlisle’s methods and then see how they perform in the real world by tracking the returns of the Quantitative Value ETF. The Quantitative Value screening process for stocks resembles a funnel: Step 1: Avoid Stocks That Can Cause a Permanent Loss of Capital This is a more elegant version of Warren Buffett’s first rule of investing: Don’t lose money. In first screening for risky stocks, Gray and Carlisle use some of the same metrics used by short seller John Del Vecchio to identify short candidates, such as days sales outstanding. They also give special attention to accrual accounting in the hopes of weeding out earnings manipulators and run additional screens for probability of financial distress. By removing the riskiest stocks from the pool at the beginning, Gray and Carlisle are a lot less likely to get sucked into a value trap. Step 2: Find the Cheapest Stocks Gray and Carlisle do extensive back testing on virtually every valuation metric under the sun, including industry standards such as price/earnings (“P/E”), price/sales (“P/S”) and price/book value (“P/B”). In the end, they opt to use the same valuation metric as Greenblatt in his Magic Formula: the Earnings Yield, defined here as earnings before interest and taxes (“EBIT”) divided by enterprise value. For those unfamiliar with the term, “enterprise value” is defined here as market cap (including preferred stock) + value of net debt, or what you might think of as the acquisition price of the company. Gray and Carlisle find that of all the assorted valuation metrics, the Earnings Yield yields the best results. Step 3: Find Highest-Quality Stocks This is another nod to both Buffett and Greenblatt. Buffett has repeated often that it is better to buy a wonderful business at a fair price than a fair business at a wonderful price, and Greenblatt tried to capture this mathematically by screening for companies that generated high returns on capital (“ROC”). Gray and Carlisle take it a step further by using an 8-year ROC figure. And they don’t stop there. Gray and Carlisle run additional screens for profitability and combine the metrics into a Franchise Power score. And taking it yet another step, they combine Franchise Power with Financial Strength to form a composite Quality score. Again, the objective here is to capture mathematically what makes intuitive sense: That companies with wide competitive moats, strong brands and strong balance sheets make superior long-term investments. So, how does the Quantitative Value model actually perform? In back-tested returns, it crushed the market. From 1974 to 2011, Quantitative Value generated compounded annual returns of 17.68% to the S&P 500’s 10.46%. Of course, we should always take back-tested returns with a large grain of salt. For a better comparison, let’s see how the Quantitative Value ETF has performed in the wild. We don’t have a lot of data to work with, as QVAL only started trading in late October 2014. But over its short life, QVAL is modestly beating the S&P 500’s price returns, 9.96% vs. 9.15%. As recently as April, it was beating the S&P 500 by a cumulative 4%. Looking at the returns of a substantially-similar managed account program managed by Gray’s firm, the “real world” results look solid. From November 2012 to May 2015, the Quantitative Value strategy generated compounded annual returns of 21.1% vs. the 18.3% return of the S&P 500. The Quantitative Value strategy was modestly more volatile (beta of 1.2) and had slightly larger maximum drawdowns (-6.0% vs. -4.4%). But this is exactly what you would expect from a concentrated portfolio. I look forward to seeing how QVAL performs over time, and I congratulate Gray and Carlisle on a book well written. Note: When referring to the book, “Quantitative Value” is italicized. When referring to the ETF or to the broader strategy, it is not. Original post Disclaimer: This article is for informational purposes only and should not be considered specific investment advice or as a solicitation to buy or sell any securities. Sizemore Capital personnel and clients will often have an interest in the securities mentioned. There is risk in any investment in traded securities, and all Sizemore Capital investment strategies have the possibility of loss. Past performance is no guarantee of future results.

Exelon Cements Credentials As A Long-Term Stock

Summary Growth investments directed at improving generational assets and growing regulated asset base will ensure rate base growth and earnings stability for the company in the long run. Recent POM acquisition approval is signaling that EXC’s regulated EPS growth will improve in coming quarters. Future cash flows remain strong due to EXC’s efforts to have a large, regulated asset base. I reiterate my bullish stance on Exelon Corporation (NYSE: EXC ); the company is making good progress on its plan to have an extended regulated asset base through acquisitions and investments. EXC’s ongoing capital investments in several infrastructure development projects will add value to shareholder wealth, which will portend well for the stock price. Moreover, the company’s nuclear operation divesture plan is still under consideration; the plan, if approved, will strengthen EXC’s competitive position in the long run. The company’s rapidly growing regulated asset base provides a foundation for stable earnings and cash flow base, which will support dividend growth in future years. EXC currently offers an attractive dividend yield of 3.9%. Attractive Long-Term Growth Path Since the start of 2015, the volatile interest rate environment has weighed on utility stocks, and the utility sector underperformed the broad market in 1H’15. Owing to improving economic conditions in the U.S., the Fed is likely to increase short-term interest rates in 2H’15, which will put pressure on the stock prices of utility companies, including EXC. Despite the fear of a rise in interest rates, I believe EXC’s performance in the coming quarters will stay strong, mainly supported by the correct strategic efforts of the company. EXC, along with other utility companies in the industry, including American Electric Power (NYSE: AEP ) and PPL Corp. (NYSE: PPL ), have a robust capital spending outlook, which will support earnings growth in the next five years. EXC is following the industry norm by making hefty growth investments and acquisitions in regulated business to secure its long-term growth. During 2014, EXC spent almost $1.78 billion on several infrastructural growth-related projects, up 46.6% year-over-year. As per its recent sustainability report, the company has invested around $3.1 billion for electric and gas utility infrastructure, which includes a $500 million investment in the installation of smart meter technology during 2015. I believe the company’s recent approach to provide safe and reliable energy is bringing convenience for customers in a way that creates value for it over the long term. Another important area of investment has been EXC’s increased focus on improving its power generation capacity through the expansion and improvement of the gas business. In this regard, the company’s previously acquired 6 natural gas power plants in Maryland have started operations from June 28. The 128MW power plants will benefit EXC by improving its natural gas production capacity in the Maryland state and will ultimately add towards its rate base growth and positively affect the stock price. Moreover, the company has recently received approval for the much-awaited PEPCO Holdings (NYSE: POM ) merger from the Delaware Public Service Commission (PSC); the $6.8 billion merger is expected to complete in 2H’15, which will strengthen the company’s regulated operations and will positively affect the stock price. The upside of this merger rests in improving the EXC business and financial risk profile, as its regulated operations will increase; the company’s management expects that the merger will add nearly 15 cents-to-20 cents to EXC’s EPS during the first full year of operation. In fact, a rate base of nearly $26 billion has been projected for the combined entity, which indicates significant upside for its future ROE and cash flows. Moving ahead, under its plan of making strategic investments in diversifying the power generation portfolio, the company is planning to spend around $16 billion over the next five years, which I believe will enhance EXC’s future financial performance. On the other side, the company’s plan to shut down its loss making, Illinois-based 6 out of 11 nuclear power plants is still on hold. Recently, five of these nuclear units have failed to clear PJM’s base residual auction; despite the inability of its nuclear units to qualify for the PJM rate base auction, analysts are hoping that EXC will generate $150 million more in capacity revenue during 2017-2018 than it would have attained if all of its capacity had cleared the auction. However, the failure to qualify for the PJM auction has strengthened the company’s case before legislatures to shut down the nuclear plants. So, either the FERC should support them or LCPS standards should be changed to support its nuclear operations. While EXC is still in talks with the FERC to lower LCPS standards, I continue to believe that the closure of nuclear power plants is positively affecting the company’s performance in the long term, and will allow the company to focus more on stable regulated operations. EXC has an attractive dividend payment plan, which is strongly backed by its healthy cash flow base. Thus far, its healthy dividend payments have earned the company a decent dividend yield of 3.9% and a modest payout ratio of 48% , which indicates that there is significant room left for further dividend hikes, if the company opts to increase the payout ratio. Given EXC’s strong commitment to having a large, regulated asset base, I continue to believe in the security and sustainability of EXC’s future cash flow base, which ensures dividend stability and dividend growth in the years ahead. I recommend investors to keep track of the upcoming 2Q’15 earnings, as the company will provide an update on its capital expenditure outlook and will discuss its plans to increase regulated operations, which could have a significant impact on the stock price. According to the company’s guidance, EXC is expected to report EPS in a range of $0.45-$0.55 for Q2’15. In contrast, analysts are anticipating EPS of $0.51 for 2Q’15. The following table shows analysts; EPS forecast for EXC’s 2Q’15. Consensus EPS Forecast Low EPS Forecast High EPS Forecast 2Q’15 $0.51 $0.48 $0.55 Source: Nasdaq.com Risks The company continues to face operational and financial risk from its nuclear energy generation assets. Moreover, uncertainty about regulatory rate approvals, changes in national energy demand, stringent environmental standards and unforeseen negative economic changes are key risks that might hamper EXC’s future stock price performance. Conclusion I am bullish on EXC and believe the company will deliver a healthy performance in the long term. The company’s growth investments directed at improving its generational assets and growing its regulated asset base will ensure rate base growth and earnings stability in the long run. Furthermore, the recent POM acquisition approval is signaling that EXC’s regulated EPS growth will improve in the coming quarters. Moreover, the company’s future cash flows remain strong due to its efforts to have a large, regulated asset base, which will support dividend growth and make dividends more stable. Analysts have also projected a healthy next five-years earnings growth of 4.9% for EXC, as shown below in the chart. Source: Nasdaq.com Disclosure: I/we have no positions in any stocks mentioned, and no plans to initiate any positions within the next 72 hours. (More…) I wrote this article myself, and it expresses my own opinions. I am not receiving compensation for it (other than from Seeking Alpha). I have no business relationship with any company whose stock is mentioned in this article.